chart patterns
How to Scan Stocks for Chart Patterns Without Hours of Chart Hunting
If you trade chart patterns, you already know the job: open a chart, look for a breakout, a flag, a triangle, a clean candlestick. Then open the next chart. And the next. Scanning stocks for chart patterns by hand works until the universe is bigger than your morning. A few dozen names is a watchlist. A few thousand names is a full-time hunt.
This guide covers how to scan stocks for chart patterns the way active traders actually need it: which setups are worth looking for, why one-chart-at-a-time fails, how an automatic chart pattern scanner should work, and a daily workflow that takes about 5 minutes instead of two hours.
What scanning for chart patterns actually means
Scanning is not the same as staring at one ticker you already like. Scanning means you run a defined set of chart patterns across a universe of stocks, and usually crypto, indices, or forex too, and keep only the names where a pattern has formed.
A useful scan answers three questions before you risk a dollar:
- Did a recognizable structure print (breakout, flag, triangle, channel, candlestick)?
- Is it on the timeframe you actually trade?
- Can you locate a stop and a target from the structure, not from hope?
If the scan cannot answer those, it is just a list of tickers. Technical analysis only helps when the pattern is specific enough to trade. That is why a chart pattern scanner is different from a generic stock screener that only filters PE, volume, or “above SMA 50.” Fundamentals and liquidity filters are useful. They do not replace reading the chart.
The chart patterns worth scanning for
You do not need every pattern in a textbook. You need the ones that repeat because traders defend the same levels. Start with a short list and ignore the rest until that list is mechanical.
Breakouts and breakdowns
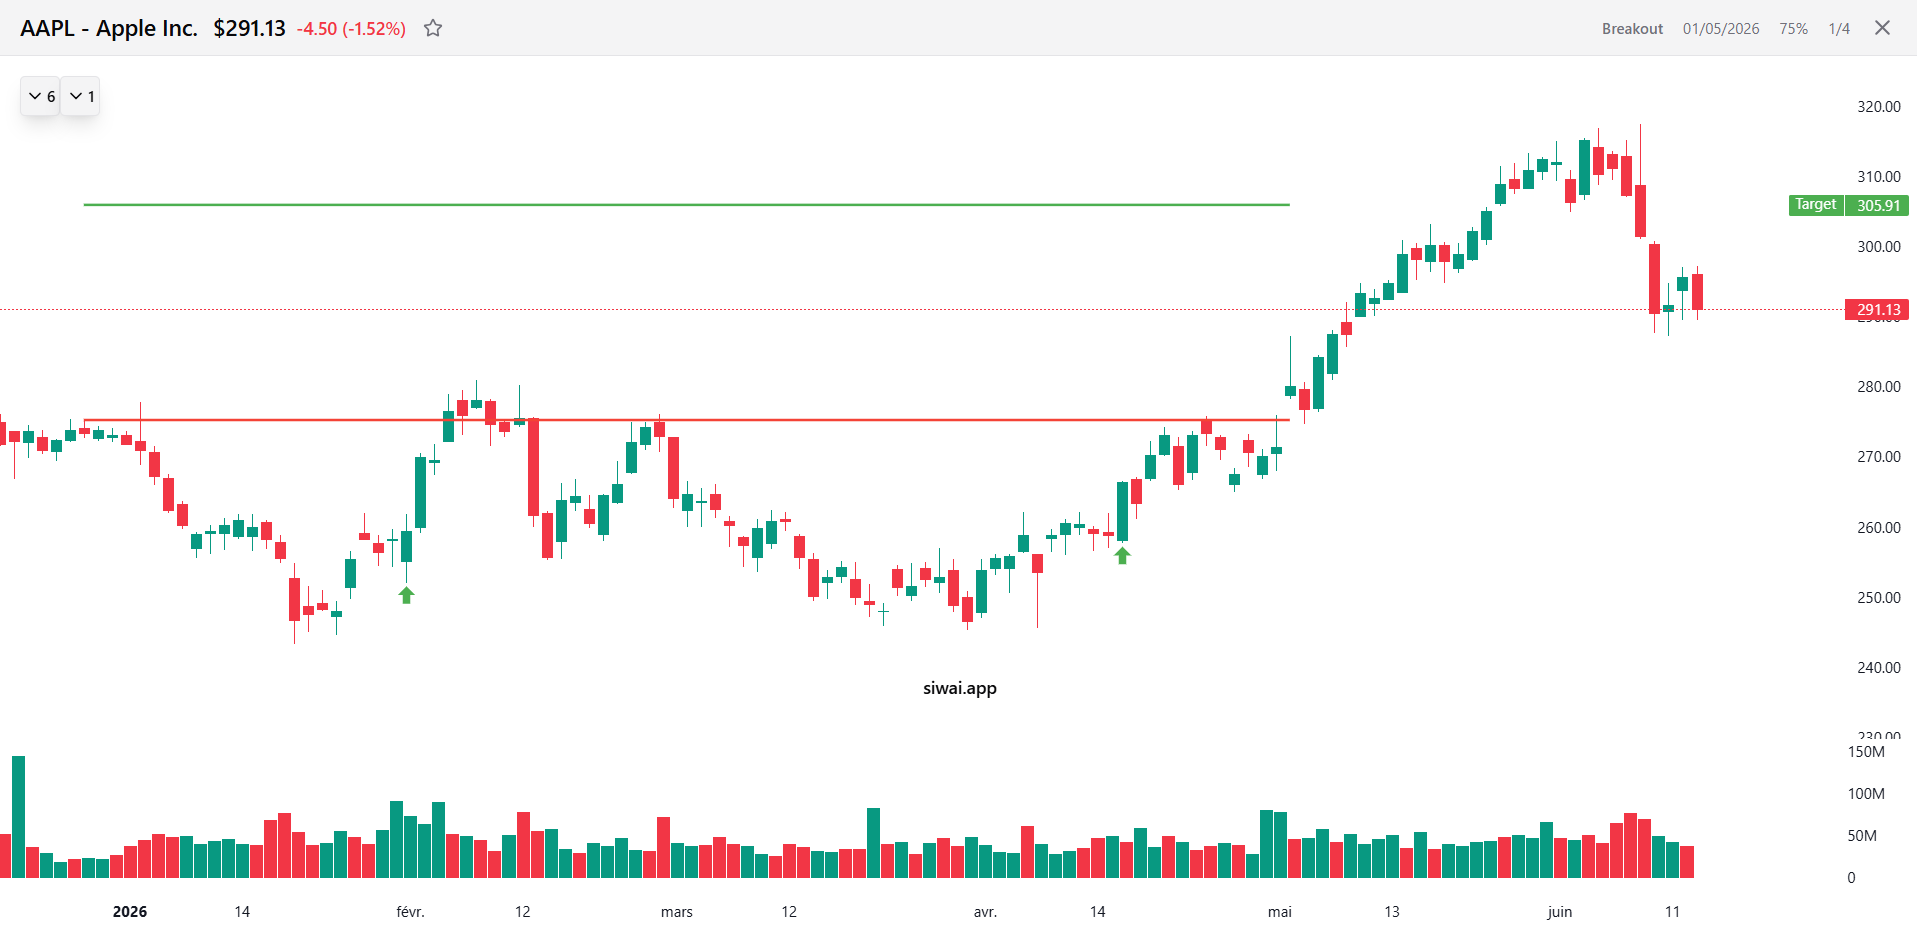
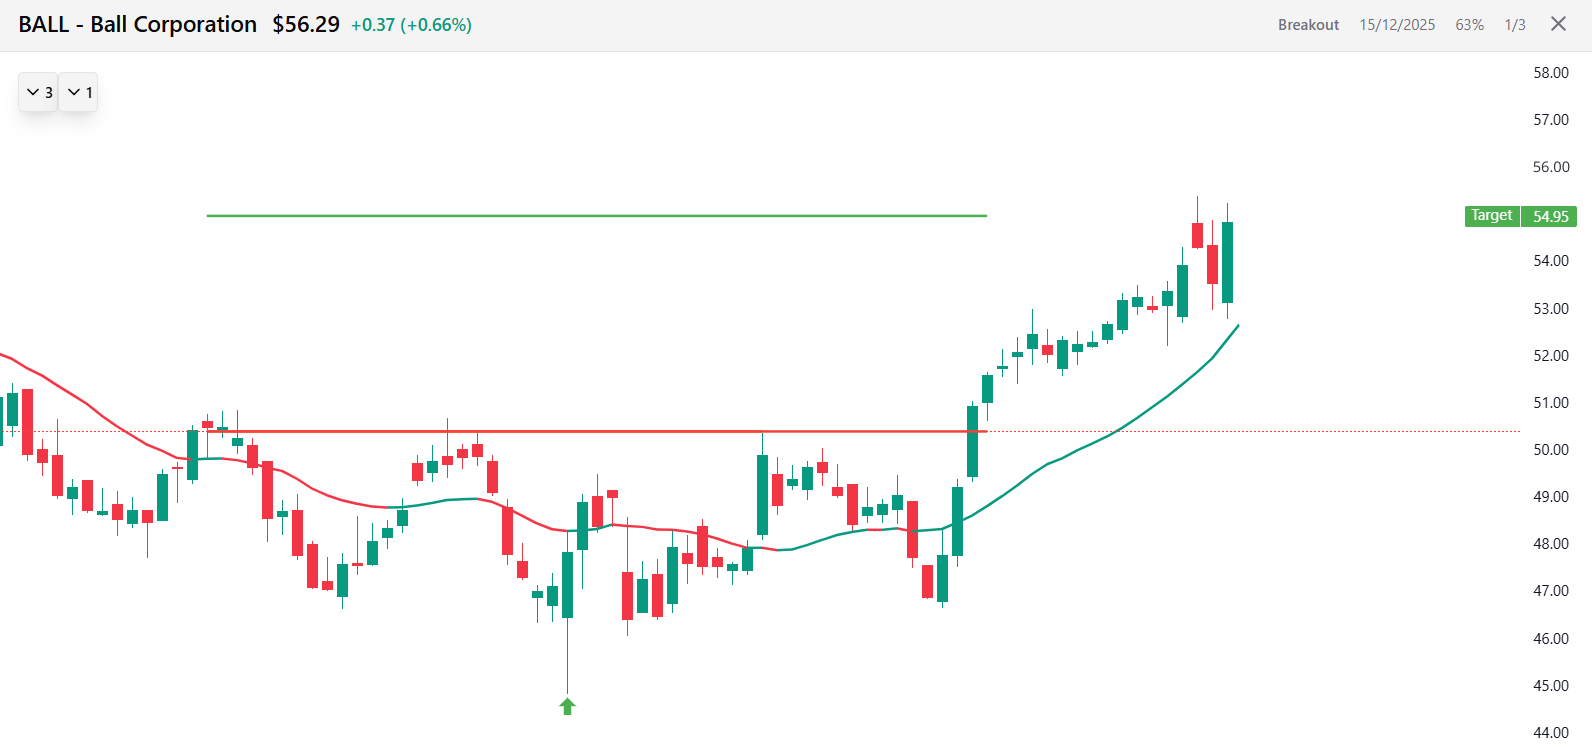
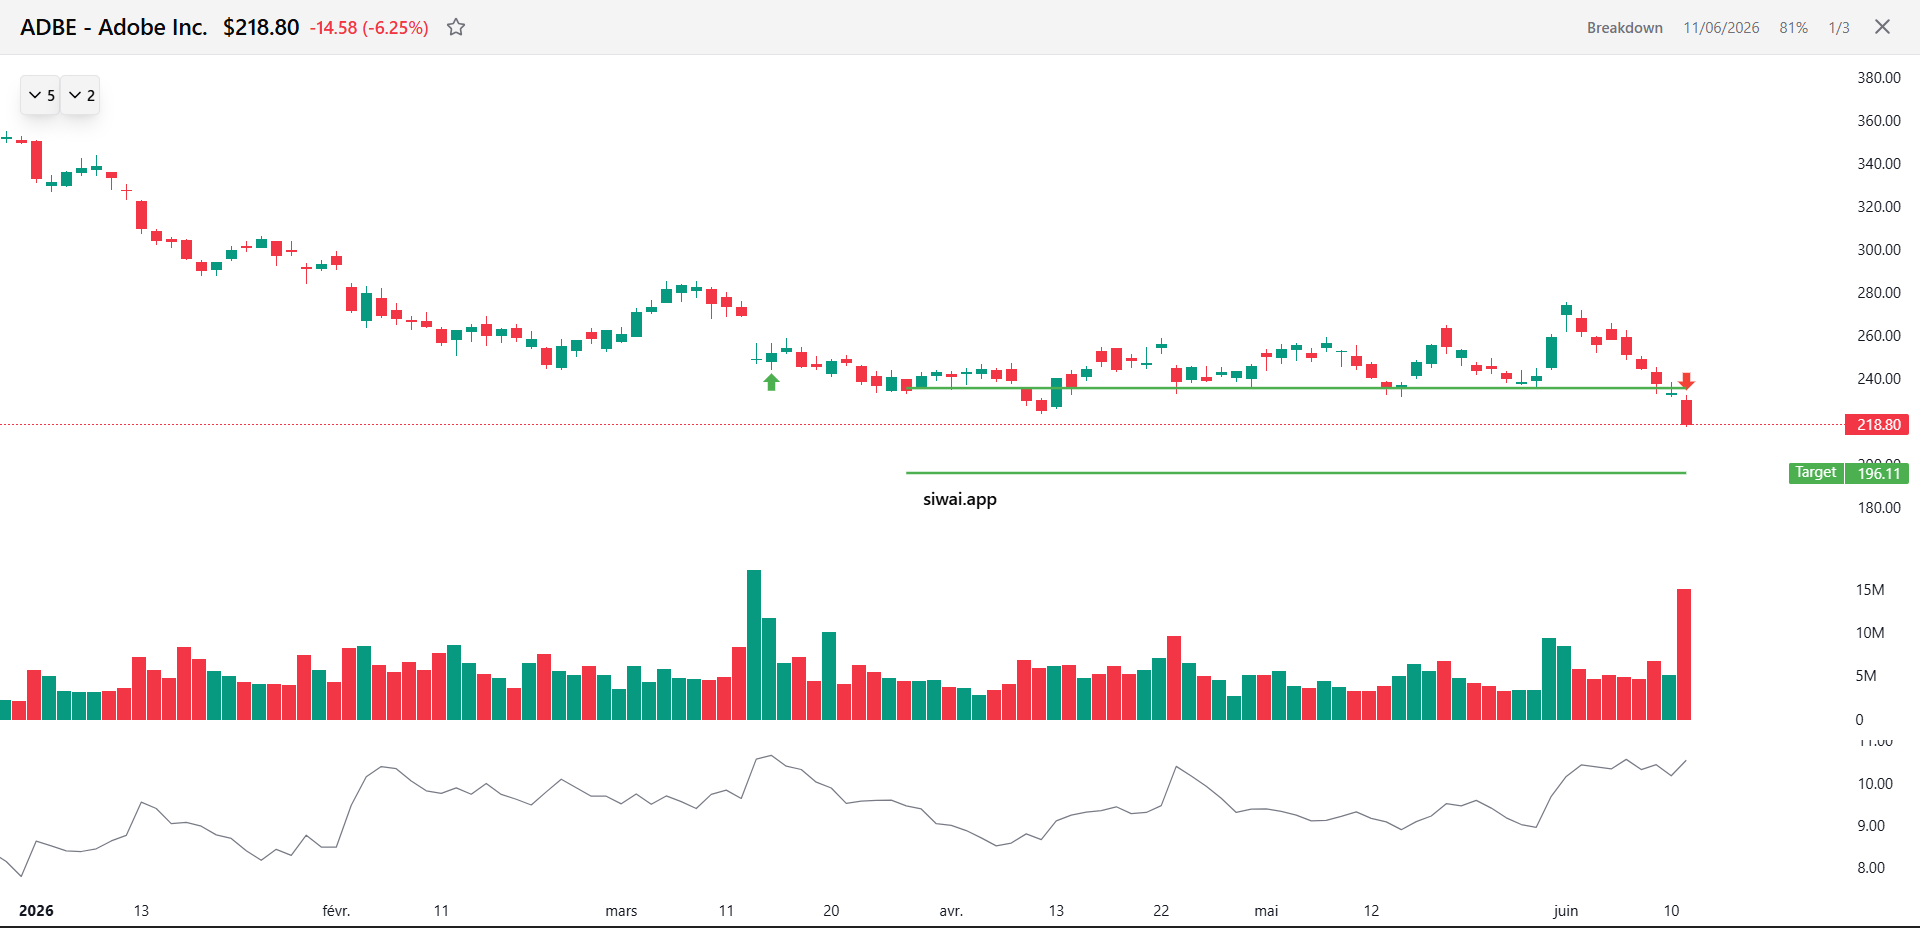
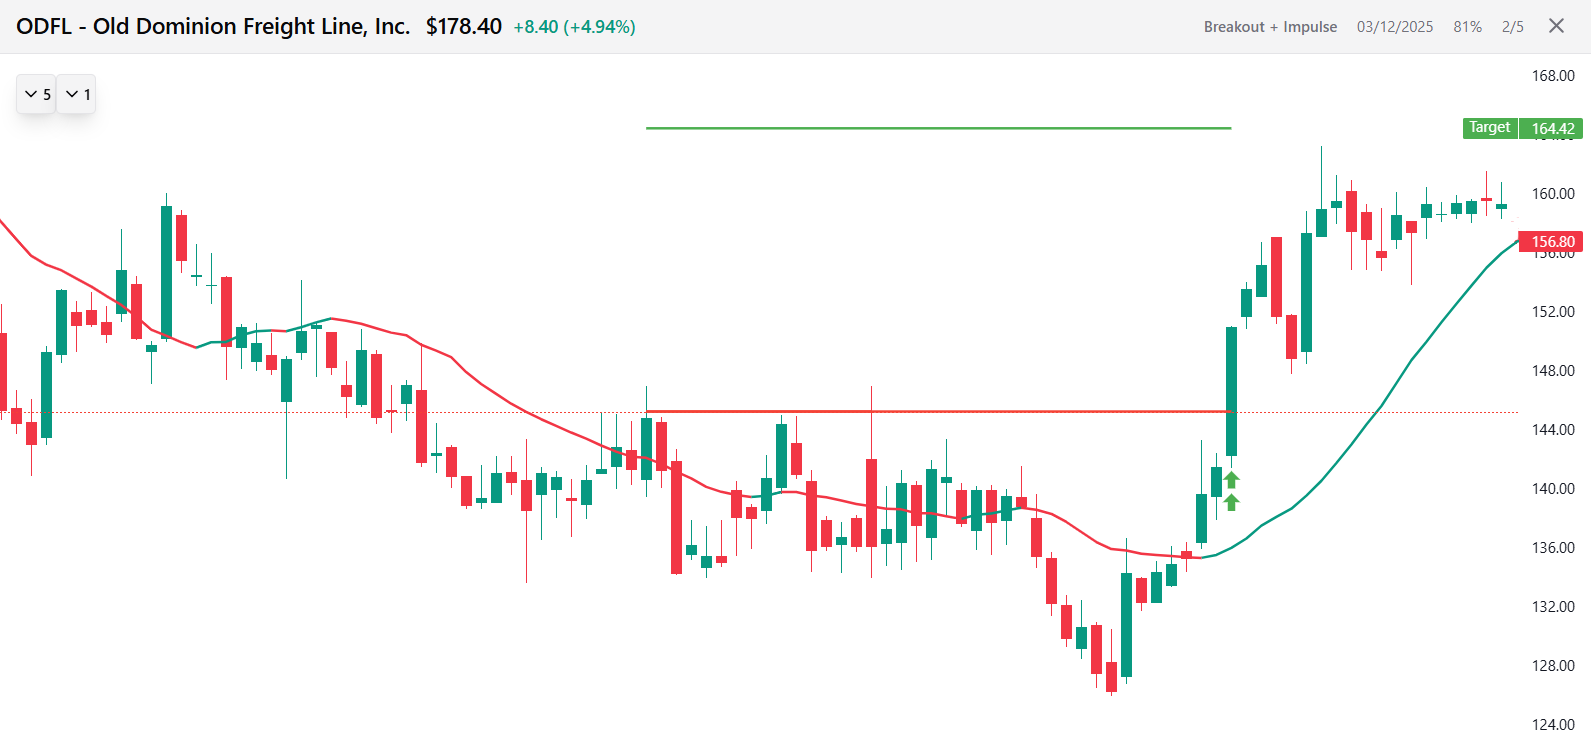
A breakout is price leaving a well-defined range or level with enough follow-through that the old resistance (or support, on a breakdown) is no longer containing the move. Traders scan for breakouts because the decision is binary: the level held or it did not. The mistake is treating every wick through a line as a breakout. Scan for structure first, a rectangle, a tight range, a prior swing high, then require a close beyond it, ideally with impulse.
Bull flags and bear flags
Flags are continuation patterns: a sharp move (the pole), then a controlled pause against that move. A bull flag drifts down or sideways on lighter activity; a bear flag drifts up. They are worth scanning because they give you a measured move and a tight invalidation under the flag. If the pause becomes a messy, wide consolidation, it is no longer a flag. A scanner that tags every pullback as a flag will bury you in noise.
Triangles, rectangles, and channels
Ascending, descending, and symmetrical triangles compress range until one side gives. Rectangles are the same idea with parallel support and resistance. Channels are trending versions of that range. These are the stock chart patterns most traders can explain in one sentence, which is exactly why they show up in a scan: lots of eyes sit on the same lines. Combine the geometry with a breakout or a failed break for a higher-quality hit.
Candlestick patterns as confirmation, not the whole trade
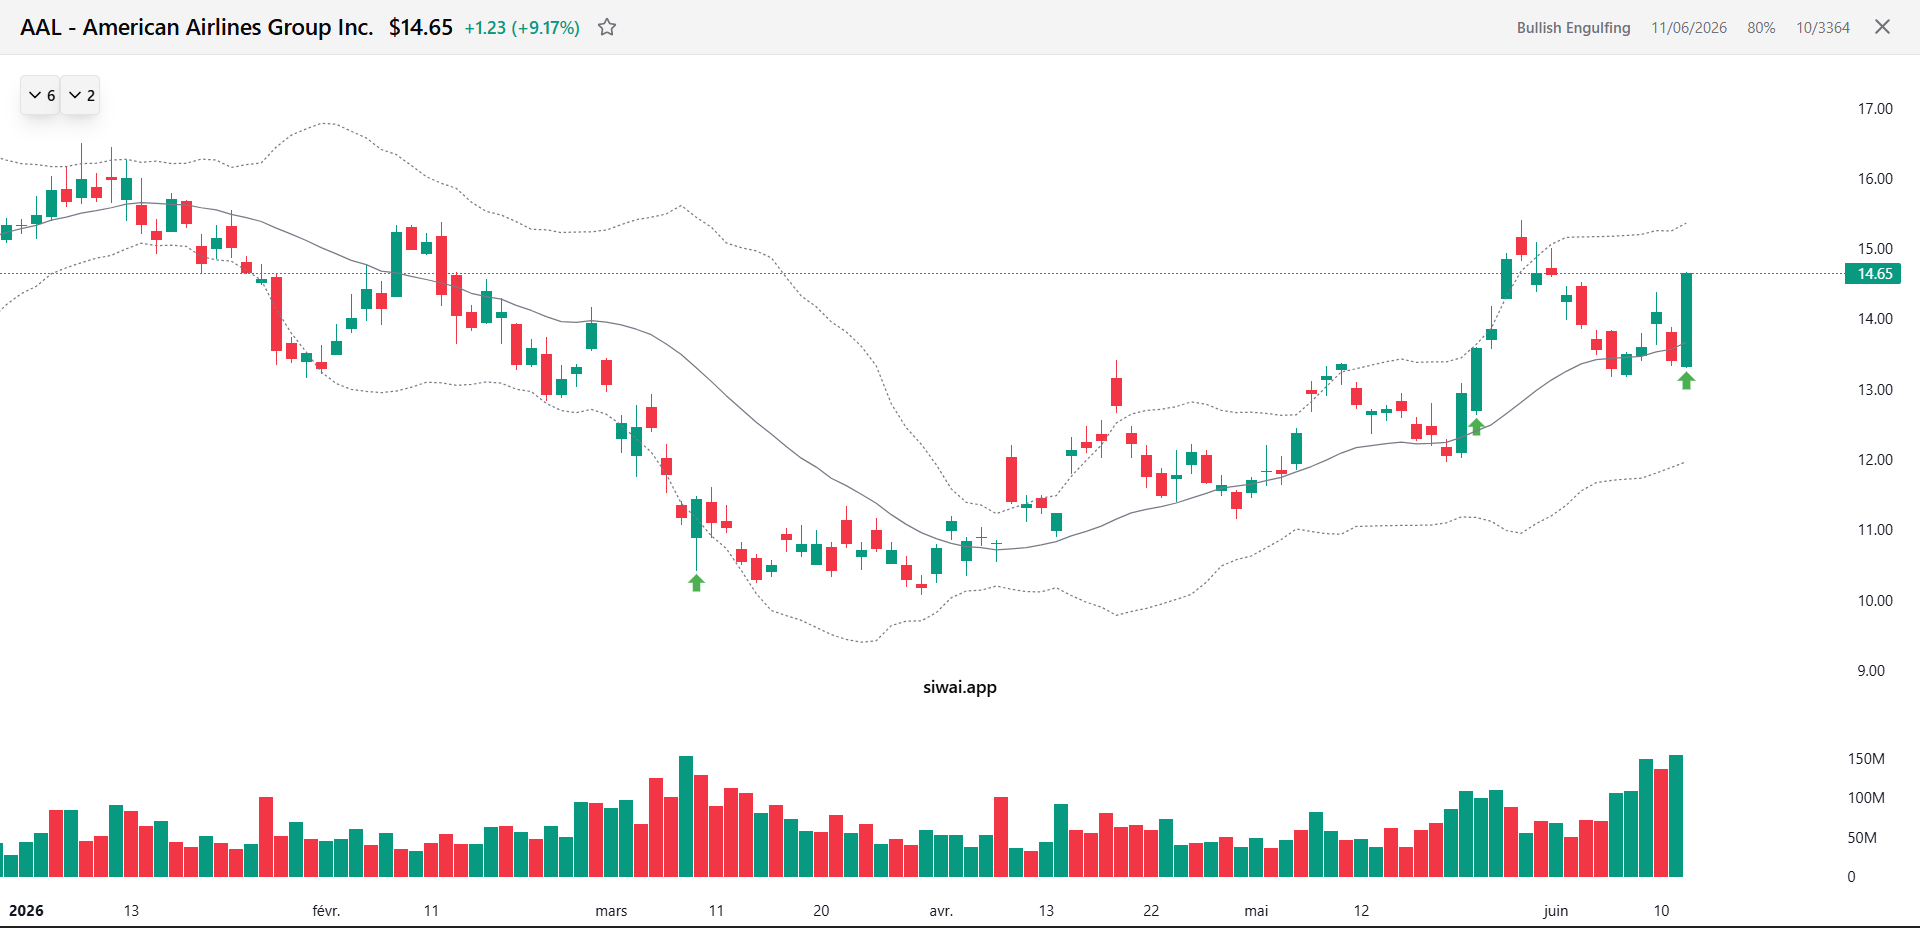
Engulfing bars, hammers, marubozu, morning and evening stars, three white soldiers. Candlestick patterns are useful when they print at a level you already care about. Scanning for a hammer in the middle of nowhere is how people overtrade. Scan candlesticks as confluence: support plus impulse, resistance plus engulfing, breakout plus a closing marubozu. The candle is the trigger. The level is the reason.
Why manual scanning fails at scale
Manual scanning is not wrong. It is slow. The market does not wait for you to finish ticker Z after you started at ticker A. Three things break down as soon as the list gets long.
| Constraint | Manual chart hunting | Pattern scanner |
|---|---|---|
| Coverage | Tens of names if you are thorough | 1,000+ names in the same pass |
| Time | Often 1 to 2 hours before the open | Minutes to review what already formed |
| Missed names | Anything you never opened | Limited to your filters, not your stamina |
| Consistency | Tired eyes skip the same pattern later | Same rules on every ticker |
That last row matters more than people admit. After an hour of scrolling, you are not applying the same definition of a bull flag that you used at 7:05. A scanner does not get bored. You still have to reject garbage, but you start from a complete list instead of a random sample.
How a chart pattern scanner works
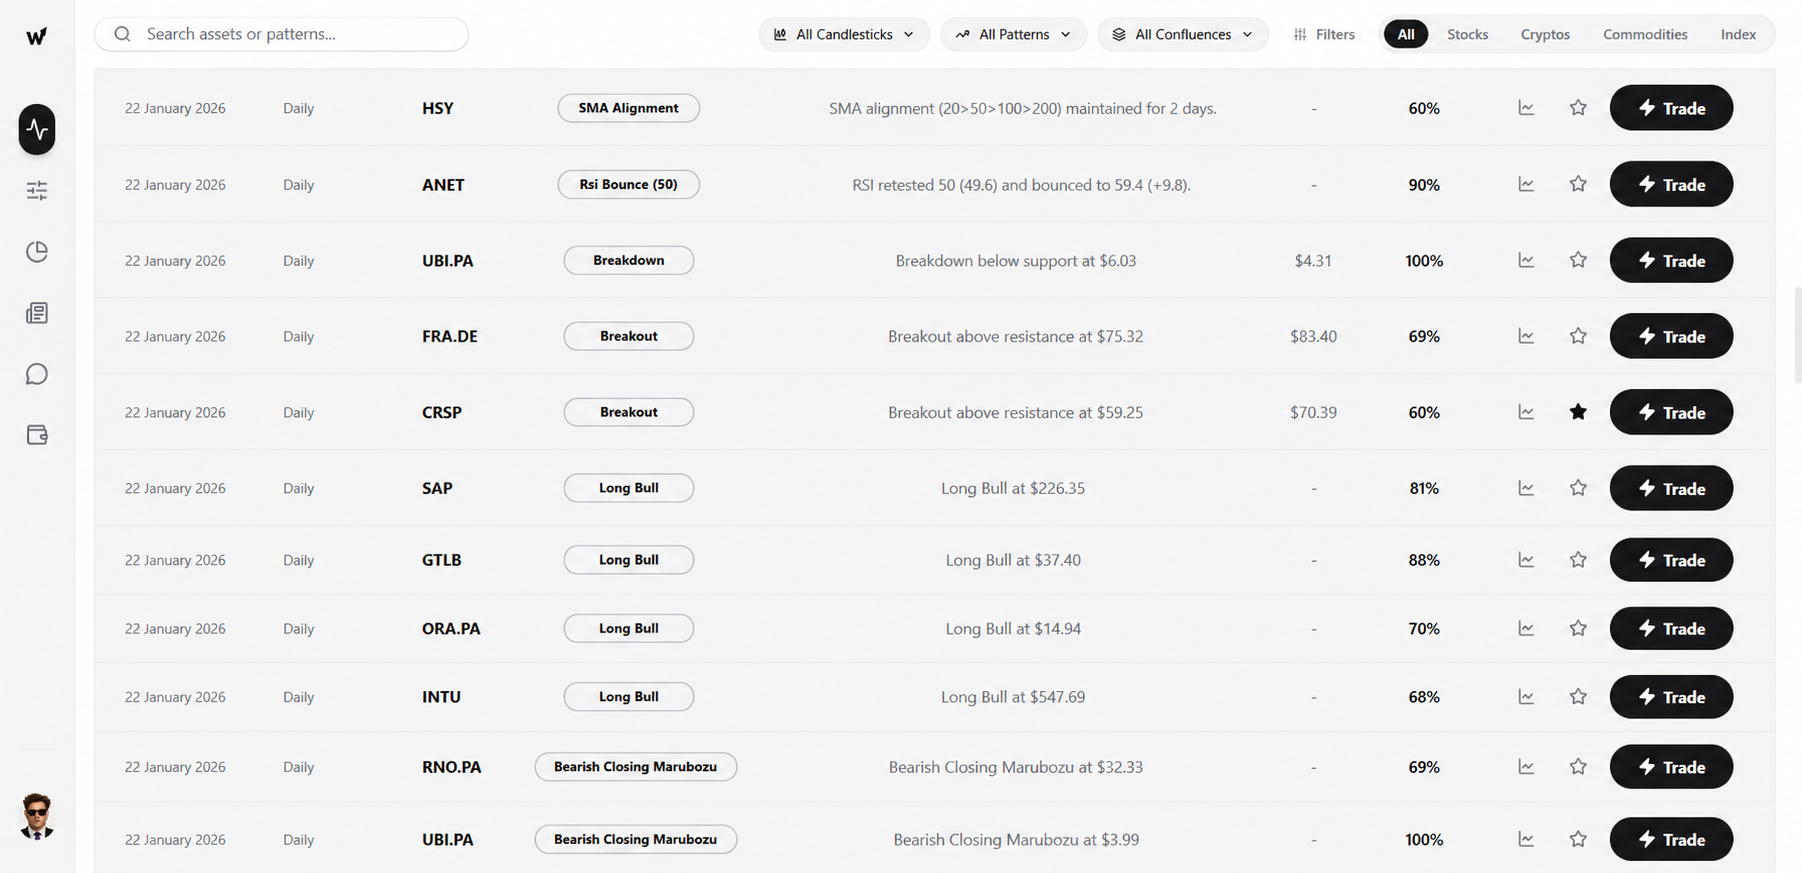
Automatic chart pattern recognition is not magic and it is not a crystal ball. The software measures swings, trend lines, ranges, and candle anatomy against rules. When the geometry matches, a rising series of lows into a flat high for an ascending triangle, a pole plus a counter-move for a flag, it surfaces the ticker.
A scanner you can trust should do at least this:
- Scan a large universe on a schedule, not only the names you remember.
- Name the pattern in language you already use (breakout, bull flag, engulfing), not a black-box score.
- Show the chart so you can confirm in seconds. If you cannot see the structure, skip it.
- Prefer confluence: pattern plus impulse, level plus candle, not isolated shapes.
- Stay a finder, not a signal service. You still size the trade and place the stop.
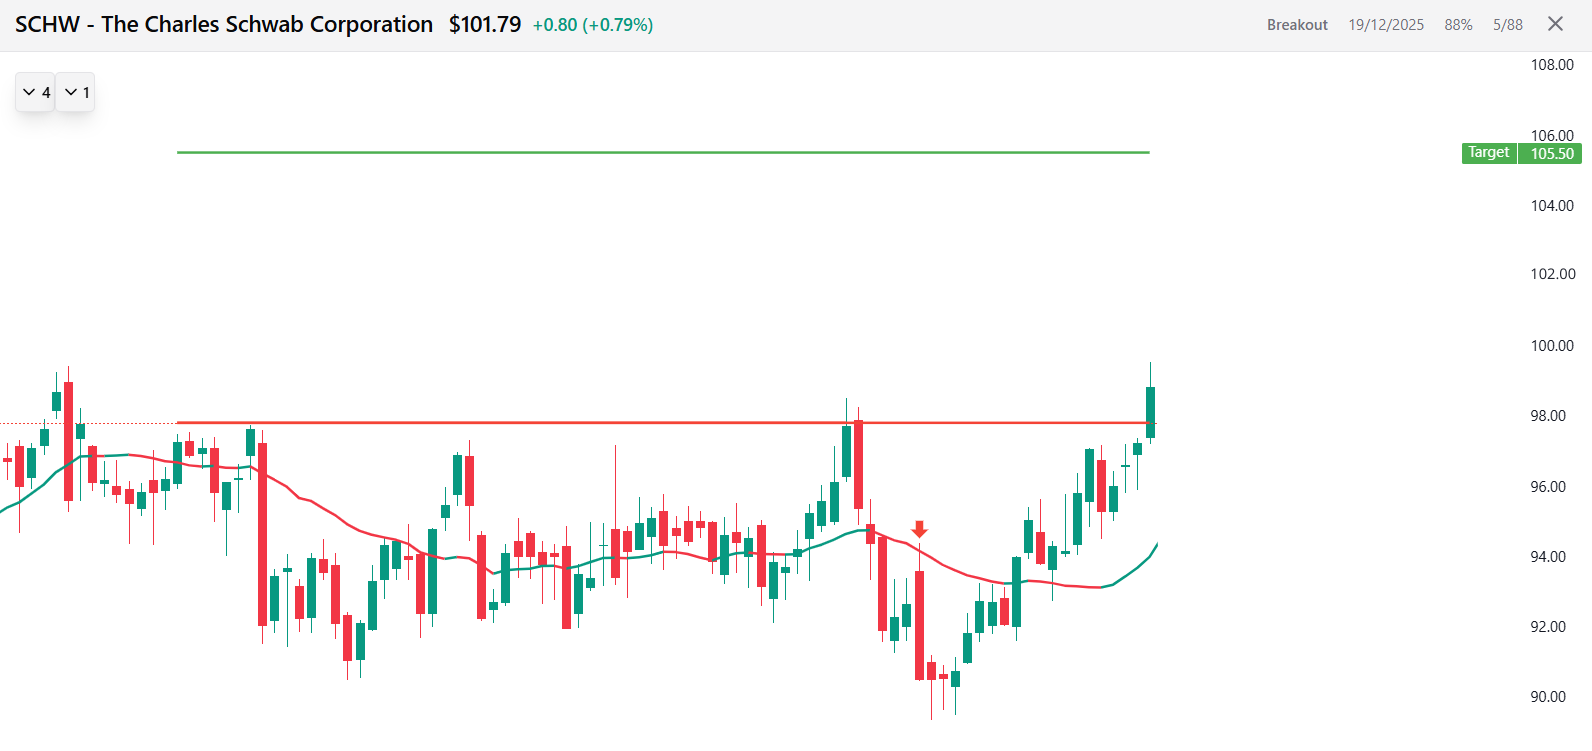
SIWAI was built around that last point. It scans 1,000+ assets for patterns and candlesticks, puts what formed in a feed, and leaves the decision with you. Confidence scores help you sort. Pre-calculated stop and target save a step. You still take the trade, or you pass. That is the difference between a scanner and a Telegram channel calling entries.
If you want the origin story, why this exists instead of another watchlist, it is on the About page. The short version: hours of manual scanning, then a tool that does the looking first.
A 5-minute daily scanning workflow
A scan is only useful if it becomes a routine. Use this sequence whether you run SIWAI or another scanner. The order matters: universe first, then pattern, then risk.
- Pick one primary timeframe. Daily for swings. 15-minute or 1-hour if you trade the session. Do not mix them in the first pass.
- Limit the pattern set. Example: breakout + impulse, bull/bear flag, engulfing at support or resistance. Three families is enough.
- Review the feed, not the whole market. Open only hits. Skip anything you cannot explain in one sentence.
- Mark invalidation and target from the structure. Use a risk/reward calculator so a 1:1 name does not sneak in because the chart “looks nice.”
- Size from the stop, not from conviction. The position size calculator exists for this. A perfect flag with a 4% stop on a 2% account-risk rule is a small position. That is correct.
- Cap the number of trades. The scan will always find more names than you should take. Two or three A-setups beat eight maybes.
Five minutes assumes the looking is already done. If you still open 400 charts by hand, you do not have a workflow problem. You have a coverage problem.
Mistakes that waste the scan
- Treating every hit as a signal. A scanner finds structure. Liquidity, news, and your own bias still exist. Pass often.
- Scanning every timeframe at once. You will always find a pattern somewhere. That is not an edge.
- Ignoring the stop because the pattern is famous. Head and shoulders, flags, and triangles fail. The stop is the trade.
- Building a 200-name watchlist instead of scanning. A watchlist is what you already know. The point of a scan is the names you would never have opened.