Blog
The SIWAI Blog
Practical guides for traders who still take the trade, and want the hunting done first.
 10 min read
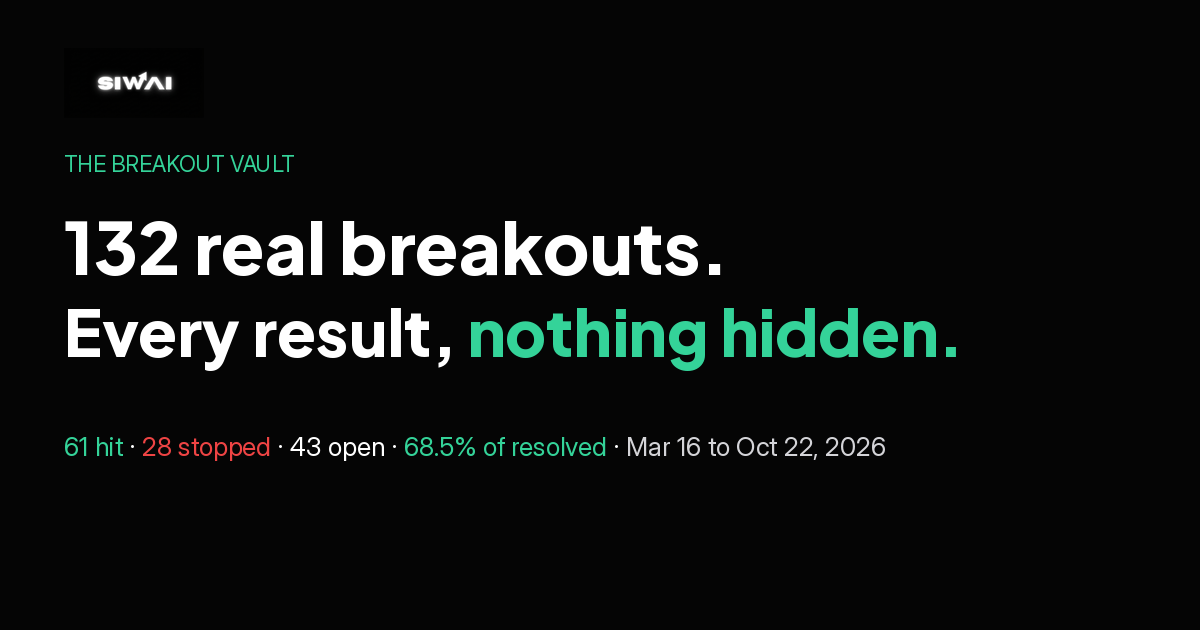
Breakout Stocks: 132 Real Breakouts With Level, Target, Stop and Outcome
132 real breakout stocks from the SIWAI feed with level, target, stop and outcome. 68.5% of resolved trades hit the target. Updated Nov 4, 2026.
Read the guide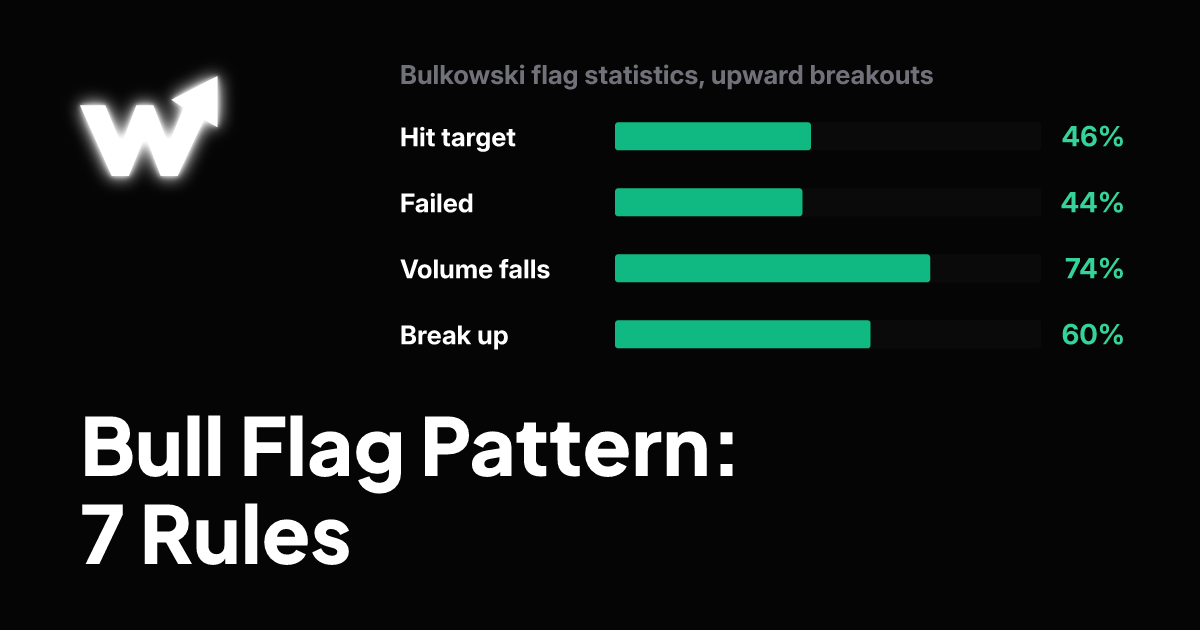 8 min read
Bull Flag Pattern: 7 Rules, the Measure Rule and When It Fails
What makes a bull flag tradeable? Learn the 7 rules, the published statistics, how the measured move works, how to size the trade and what to do when the flag fails.
Read the guide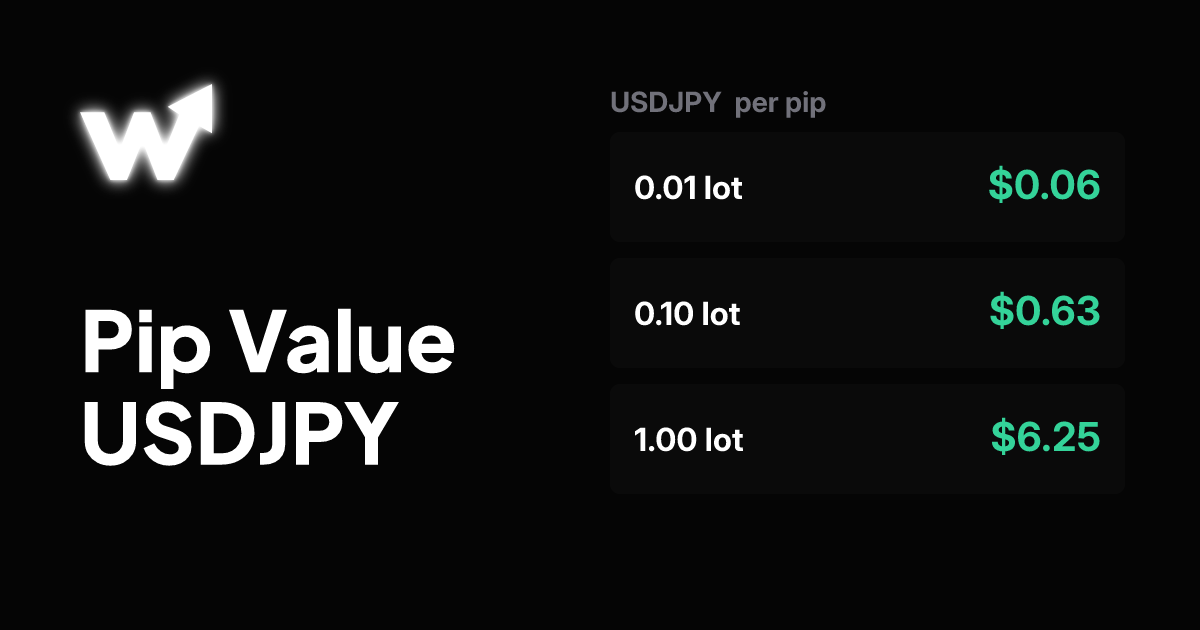 9 min read
How to Calculate Pip Value: USDJPY, EURUSD and GBPJPY Worked Examples
One pip on 1.0 lot of USDJPY was worth $6.25 at the Nov 13, 2026 close, against $10 on EURUSD. Learn the pip value formula, count pips on JPY pairs and size any trade from it.
Read the guide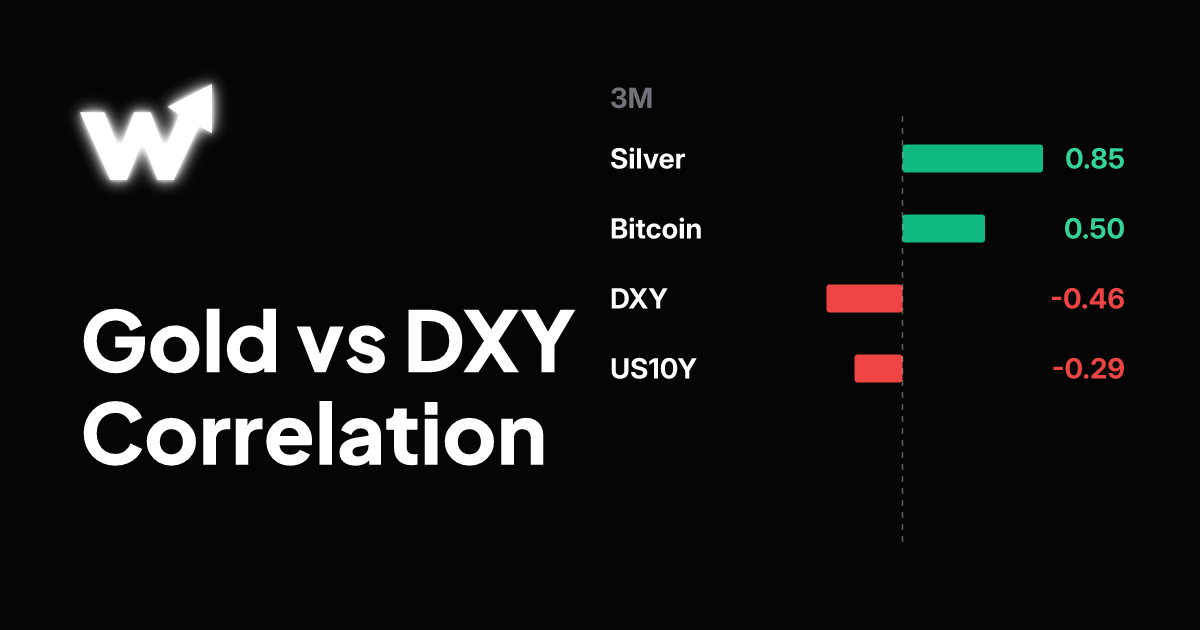 9 min read
Gold vs DXY Correlation: Why Gold Fell 5.5% as the Dollar Rose (Nov 2026)
Gold and the US dollar index had a -0.46 correlation over three months to Nov 13, 2026. In the week of Nov 9 the DXY rose 1.7% and gold fell 5.5%. Full table, exceptions, sensitivity and lot sizing.
Read the guide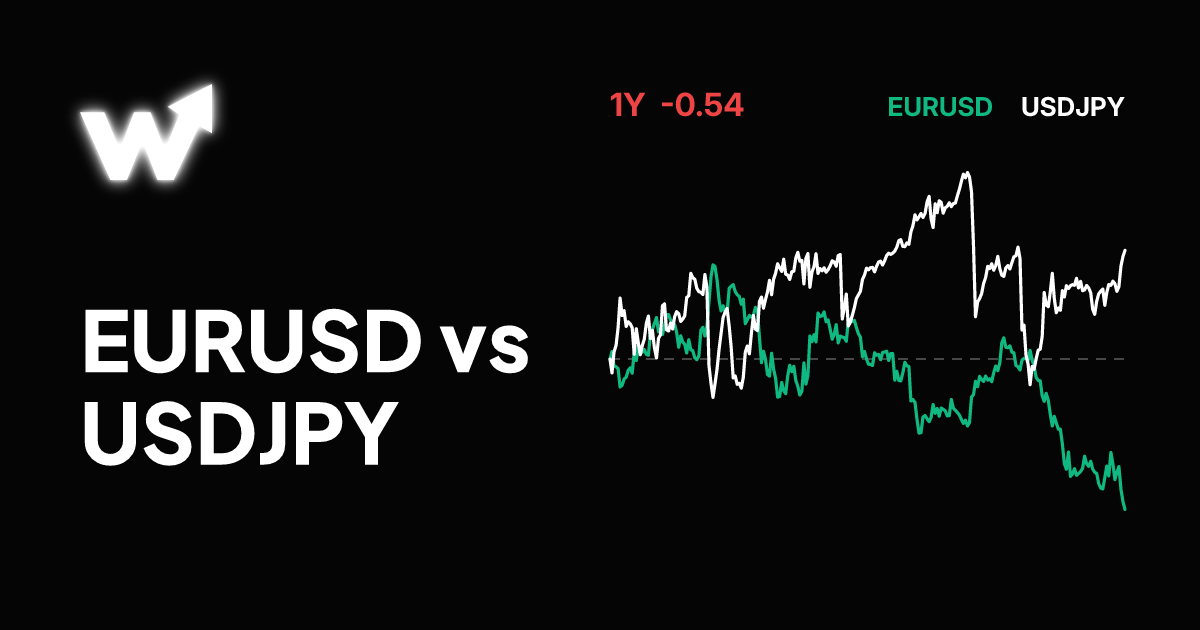 8 min read
EURUSD vs USDJPY Correlation: Why They Mirror Each Other and When They Split
EURUSD and USDJPY had a -0.54 correlation over one year to Nov 13, 2026 and closed in opposite directions on 188 of 256 days. Full table, dollar days vs yen days, stacked risk and lot sizing.
Read the guide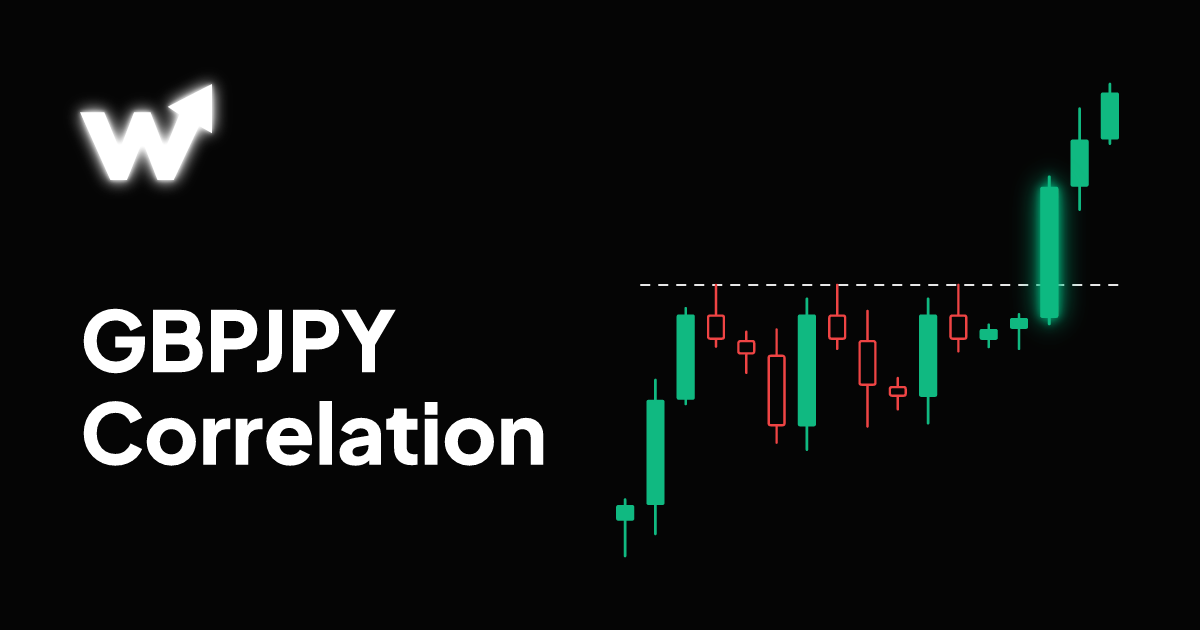 8 min read
GBPJPY Correlation: Which Pairs Double Your Risk and Which Hedge It
GBPJPY had a 0.90 correlation with EURJPY and 0.66 with USDJPY over one year to Nov 11, 2026, but only 0.33 with GBPUSD and -0.36 with EURGBP. Full table, stacked risk and lot sizing.
Read the guide 8 min read
EURJPY Correlation: Which Pairs Move With EURJPY and Which Do Not
EURJPY had a 0.90 correlation with GBPJPY and 0.70 with USDJPY over one year to Nov 11, 2026, but only 0.22 with EURUSD. Full table, euro days vs yen days, stacked risk and lot sizing.
Read the guide 9 min read
GBPUSD Lot Size: How to Calculate Position Size on Cable, Step by Step
One lot of GBPUSD is $10 per pip at any price. Size any cable trade from risk money and stop, with real ECB move data (37.9 pips a day on average) and tables at 1% risk.
Read the guide 8 min read
MSFT vs QQQ Correlation After the November 2026 Tech Selloff: Why Microsoft Held Up
QQQ fell 6.49% on Nov 5, 2026 and Microsoft fell 3.58%. Their correlation was only 0.53 over three months. Real numbers on beta, stacked risk, hedging and position sizing.
Read the guide 8 min read
AUDUSD vs USDCAD: Correlation, Volatility and Lot Sizing for the Aussie and Loonie
AUDUSD and USDCAD had a -0.57 correlation over three months to Nov 6, 2026, yet AUDUSD swung about 1.5 times as much. Real numbers on pips, the Nov 6 Aussie selloff, stacked risk and lot sizing.
Read the guide 8 min read
EURUSD vs USDCAD Correlation: Live Readings, Risk Stacking and Lot Sizing
EURUSD and USDCAD had a -0.54 correlation over three months to Nov 5, 2026, softening to -0.27 over one month as the Canadian dollar strengthened. See every window, stacked risk and lot tables.
Read the guide 9 min read
EURJPY Lot Size: Formula, Pip Value and Position Size Tables
One lot of EURJPY pays 1,000 yen per pip, about $6.32 at USDJPY 158.29. Size any trade from risk money and stop, with real daily move data and tables at 1% risk.
Read the guide 9 min read
UK100 Lot Size: How to Calculate Position Size on the FTSE 100, Step by Step
One lot of UK100 usually pays £1 per FTSE 100 point. Size any trade in four steps, with real daily move data, lot tables at 1% risk and the decimals and futures traps.
Read the guide 8 min read
AUDUSD and USDJPY Correlation: Risk On, Risk Off and the Week of Nov 3, 2026
AUDUSD and USDJPY usually lean against each other: a -0.30 correlation over one year to Nov 2, 2026. In October the one month reading flipped to +0.22. What that means around the RBA decision, the US midterms and the jobs report.
Read the guide 8 min read
EURJPY vs GBPJPY: Correlation, Volatility and How to Size Both in 2026
EURJPY and GBPJPY had a 0.95 correlation over three months to Oct 30, 2026, yet split in October as EURGBP fell. Real numbers on pips, volatility, stacked risk and lot sizing.
Read the guide 8 min read
Gold and Oil Correlation in 2026: Why Brent Rose While Gold Fell
Gold and Brent had a -0.20 correlation over three months to Oct 30, 2026 while Brent rose 29.6% and gold fell 3.4%. Real gold correlations with oil, copper, silver and the dollar, plus lot sizing.
Read the guide 9 min read
Inverse Head and Shoulders Pattern: How to Spot It, Measure the Target and Trade the Breakout
The inverse head and shoulders is a bullish bottom confirmed by a close above the neckline. Learn the five rules, the target formula with a worked example, the stop and the real success rate.
Read the guide 9 min read
NAS100 Lot Size: How to Calculate Position Size on the Nasdaq 100, Step by Step
One lot of NAS100 usually pays $1 per Nasdaq 100 point. Size any trade in four steps, with real daily move data, lot tables at 1% risk and the decimals and futures traps.
Read the guide 8 min read
USDJPY Correlation in BoJ Week: Why Yen Crosses Now Lead the Pair
USDJPY had a 0.87 correlation with GBPJPY and 0.85 with EURJPY over three months to Oct 28, 2026, but only -0.45 with EURUSD. What that means for risk in BoJ week.
Read the guide 8 min read
USDCHF Correlation: EURUSD vs USDCAD, Which Pair Mirrors the Swissie Better?
USDCHF had a -0.60 correlation with EURUSD and 0.63 with USDCAD over three months to Oct 27, 2026, down from -0.88 in September. See both pairs, the risk and lot sizing.
Read the guide 8 min read
NZDUSD Correlation: Which Pairs Move With the Kiwi, and How to Avoid Doubling Your Risk
NZDUSD had a 0.74 correlation with GBPUSD and -0.70 with USDCHF over three months to Oct 23, 2026. See every major pair, the risk math and lot sizing.
Read the guide 9 min read
EURUSD Lot Size: Why 1.0 Lot Is Always $10 a Pip, and How to Size Every Trade
On EURUSD, 1.0 lot is $10 per pip, 0.10 lot $1 and 0.01 lot 10 cents, at any price. Get the formula, worked examples and ready lot tables at 1% risk.
Read the guide 9 min read
USDCHF Lot Size: Why a Swiss Franc Pip Is Worth More Than $10, and How to Size Every Trade
On USDCHF, 1.0 lot pays 10 Swiss francs per pip, about $12.13 at the ECB rate of 0.82435. Get the formula, worked examples and ready lot tables at 1% risk.
Read the guide 7 min read
USDCAD Correlation in October 2026: Oil Near $108, and Why the Loonie Is Not Following
WTI crude is up 85% in a year, yet USDCAD is flat and its oil correlation sits near zero. See the October 2026 readings, the BoC date and the lot math.
Read the guide 8 min read
AUDUSD vs EURUSD Correlation: How Closely They Move, and When the Link Breaks
AUDUSD and EURUSD share the US dollar, but their correlation was only 0.52 over three months to Oct 21, 2026. See the readings, the breaks and the risk math.
Read the guide 9 min read
US30 Lot Size: What 0.01 Lot of the Dow Is Worth, and How to Size Every Trade
One lot of US30 usually pays $1 per Dow point, so 0.01 lot pays $0.01. Get the formula, ready lot tables at 1% risk, the decimals trap and NAS100 sizing.
Read the guide 9 min read
USDJPY and GBPJPY Lot Size: Why a Yen Pip Is Not $10, and How to Size Every Trade
On every JPY pair, 1.0 lot pays 1,000 yen per pip, about $6.33 at a USDJPY rate of 158.02. Get the formula, worked examples and ready lot tables at 1% risk.
Read the guide 9 min read
BTCUSD Lot Size: What 0.01 and 1.0 Lot of Bitcoin Are Worth, and How to Size by Risk
One lot of BTCUSD is usually 1 bitcoin: $1 per $1 move, so 0.01 lot is $1 per $100 move. Get the formula, ready tables at 1% risk, the points trap, and ETHUSD sizing.
Read the guide 8 min read
Why Do Stocks Drop After Good Earnings? What Q3 2026 Bank Earnings Just Showed
Goldman, Citi and Morgan Stanley beat estimates and still fell. Here is why good earnings can sink a stock, and how to trade the chart once the reaction settles.
Read the guide 9 min read
Bull Flag vs Bull Pennant vs Rising Wedge: How to Tell Them Apart Before the Breakout
Flags pause between parallel lines, pennants between converging ones, and rising wedges often break down. Learn the differences, the data, and the trade plan.
Read the guide 9 min read
XAUUSD Lot Size: 0.01 Lot Is 1 Ounce of Gold, 1.0 Lot Is 100 Ounces
0.01 lot of gold is 1 troy ounce, so every $1 move is $1 of P and L. 1.0 lot is 100 ounces and $100 per $1. Formula, tables and the 0.01 shortcut.
Read the guide 10 min read
The Most Reliable Candlestick Patterns, and What the Research Actually Says
No candle is a standalone edge. Use a short cheat sheet, demand trend and level context, then size stop and target with SIWAI tools.
Read the guide 9 min read
How to Use Currency Correlation in Forex: Pairs That Move Together, and Pairs That Cancel Out
Positive correlation stacks the same theme. Negative correlation can cancel it. Learn the pairs, check live readings, and size lots from one risk budget.
Read the guide 9 min read
CPI Day Chart Setups in Gold, USDJPY and EURUSD
CPI day is two sessions away. Mark gold, USDJPY and EURUSD levels now, size wider stops with fixed dollar risk, and trade the break after the print.
Read the guide 9 min read
Inverted Hammer vs Shooting Star vs Hammer vs Hanging Man: One Shape, Four Meanings
Four lookalike candles, four meanings. Sort inverted hammer vs shooting star and hammer vs hanging man by trend, then confirm, size, and manage risk.
Read the guide 10 min read
How Many Lots Can I Trade With $100, $500 or $1,000? Tables for Forex, Gold, US30 and Bitcoin
Account size alone does not set lot size. Tables for $100, $500 and $1,000 at 1% risk across EURUSD, gold, US30 and Bitcoin, plus the formula behind every cell.
Read the guide 9 min read
Head and Shoulders Pattern: Bullish or Bearish? Rules, Targets and Real Scanner Examples
Classic head and shoulders is a bearish top. Inverse is a bullish bottom. Rules, measured targets, stop placement, and how to scan for confirmed neckline breaks.
Read the guide 9 min read
How to Calculate Lot Size in Forex, With Worked Examples for EURUSD, GBPJPY and USDJPY
Turn stop distance into lot size. Pip value for EURUSD, GBPJPY and USDJPY, the lot size formula, and worked examples you can rerun in the SIWAI calculators.
Read the guide 8 min read
Chart Patterns to Watch as October 2026 Opens
The jobs report lands October 2. Which chart patterns and candlestick setups to watch on NAS100, US30, bitcoin, and gold when volatility hits, and how to position before the data.
Read the guide 8 min read
US30 vs NAS100: Are They the Same? Key Differences and How to Size Each
US30 and NAS100 (US100) are not the same index: 30 price weighted blue chips versus 100 tech heavy Nasdaq stocks. Weighting, volatility, point value and worked sizing for both.
Read the guide 6 min read
How to Calculate Risk Reward Ratio Before Entering a Trade
The calculation that decides if a setup is worth taking. How to calculate risk reward ratio before entry, what minimum to use, and mistakes that ruin the math.
Read the guide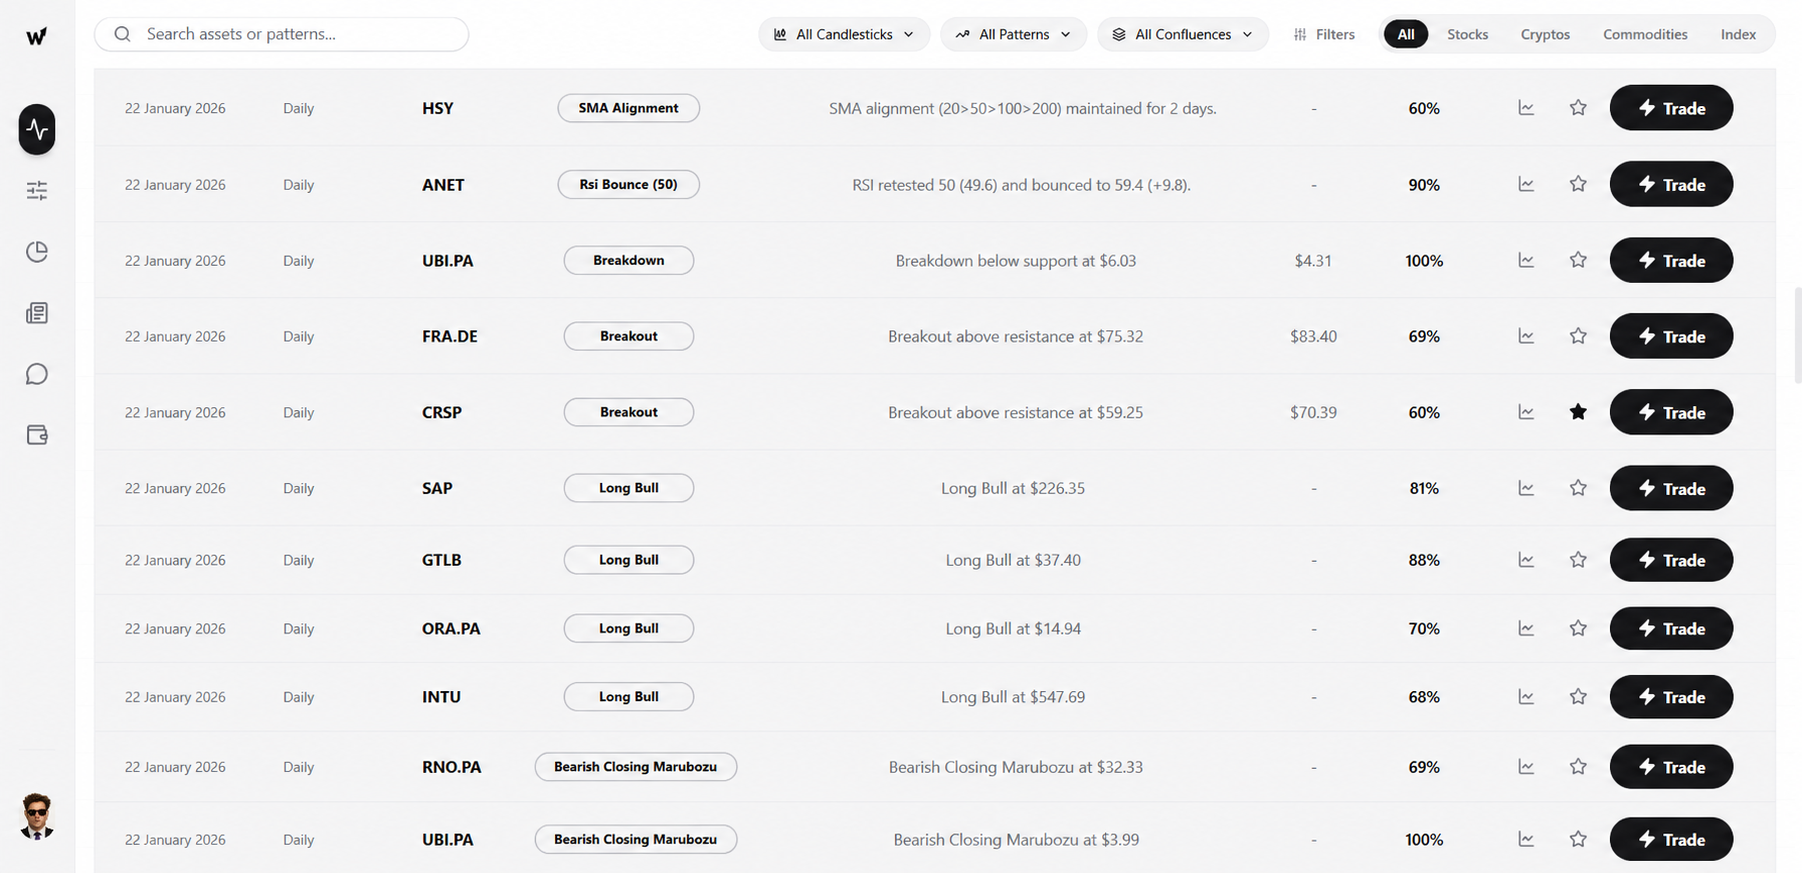 5 min read
How to Scan Stocks for Chart Patterns Without Hours of Chart Hunting
A practical guide to scanning stocks for chart patterns: which setups are worth hunting, why one-chart-at-a-time fails, and how to review the market in 5 minutes.
Read the guide