AUDUSD
AUDUSD and USDJPY Correlation: Risk On, Risk Off and the Week of Nov 3, 2026
AUDUSD and USDJPY are the two classic risk pairs in forex, and they usually pull in opposite directions. On ECB reference rates to November 2, 2026, their daily returns had a correlation of -0.30 over one year and -0.21 over three months. Over the last month the sign flipped: the one month reading is +0.22.
This week packs three events that can move both pairs at once: the Reserve Bank of Australia decision on November 3, the US midterm elections the same day and the US jobs report on November 6. This guide covers why the two pairs are linked, what the October flip means, how to read them around each event and how to size both without stacking risk. You can check the live reading on the free AUDUSD vs USDJPY correlation page.
Why AUDUSD and USDJPY are risk pairs
The Australian dollar tends to gain when traders are buying growth and commodities (risk on), and the Japanese yen tends to gain when they are cutting risk (risk off). In a pure risk on move, AUDUSD rises and USDJPY also rises as the yen weakens. That pushes the two pairs in the same direction.
The US dollar pulls the other way. It sits on opposite sides of the two pairs: it is the quote currency in AUDUSD and the base currency in USDJPY. A broad dollar rally pushes AUDUSD down and USDJPY up, so dollar news drives the pairs apart. Which force wins decides the sign of the correlation coefficient. Over the last two years the dollar leg has won most of the time, which is why the long run reading is negative.
There is a neat shortcut: AUDUSD times USDJPY equals AUDJPY. On November 2, 2026, 0.7008 times 157.90 gives 110.66, the AUDJPY rate. So being long AUDUSD and long USDJPY together is close to being long AUDJPY, the purest risk on and risk off cross, because the dollar cancels out.
AUDUSD and USDJPY correlation by time frame
The inputs are ECB euro reference rates (see the ECB reference rates page) loaded through the Frankfurter exchange rate API, converted to AUDUSD and USDJPY and compared as daily percentage returns. All windows end on November 2, 2026.
| Window | Correlation | Same direction days | Share |
|---|---|---|---|
| 1 month | +0.22 | 11 of 21 | 52% |
| 3 months | -0.21 | 27 of 65 | 42% |
| 6 months | -0.27 | 44 of 130 | 34% |
| 1 year | -0.30 | 95 of 254 | 37% |
| 2 years | -0.33 | 190 of 514 | 37% |
A reading between -0.2 and -0.35 is a weak to moderate negative link. It is nowhere near the 0.9 readings you see between two yen crosses, so AUDUSD and USDJPY are not mirror images. They mostly lean against each other, and they move apart on about six days out of ten over one and two years.
The rolling three month reading has changed a lot. Sampled about once a month since January 2025, it was most negative at -0.71 in the window ending September 23, 2025, and weakest at -0.05 in the window ending May 28, 2025. It has stayed between -0.19 and -0.28 since July 2026, and the latest three month value is -0.21.
How both compare with other pairs
AUDUSD moves with the other dollar majors, and USDJPY moves against them, because of the shared dollar leg. Both have a clearly positive link with AUDJPY, which contains a piece of each.
| Pair | AUDUSD 3M | AUDUSD 1Y | USDJPY 3M | USDJPY 1Y |
|---|---|---|---|---|
| AUDJPY | 0.53 | 0.59 | 0.71 | 0.59 |
| NZDUSD | 0.59 | 0.78 | -0.36 | -0.41 |
| GBPUSD | 0.54 | 0.73 | -0.36 | -0.48 |
| EURUSD | 0.49 | 0.68 | -0.40 | -0.54 |
| USDCAD | -0.47 | -0.57 | 0.47 | 0.35 |
| USDCHF | -0.27 | -0.58 | 0.44 | 0.57 |
For more on each leg, see the AUDUSD vs EURUSD correlation guide, the USDJPY correlation guide and the NZDUSD correlation guide.
Why the link turned positive in October 2026
From October 2 to November 2, 2026, AUDUSD rose from 0.6939 to 0.7008 (+1.00%) and USDJPY edged up from 157.67 to 157.90 (+0.15%). With both pairs up, AUDJPY gained 1.14%, from 109.41 to 110.66. USDJPY barely moved while AUDUSD climbed, so most of the action came from the Australian dollar side, the dollar leg did not dominate, and the one month correlation turned positive.
| Change | 1 month | 3 months | 6 months | 1 year |
|---|---|---|---|---|
| AUDUSD | +1.00% | +0.02% | -2.43% | +7.11% |
| USDJPY | +0.15% | +0.78% | +0.50% | +2.39% |
| AUDJPY | +1.14% | +0.80% | -1.95% | +9.66% |
The one year column shows the same thing on a bigger scale. AUDUSD gained 7.11% (0.6543 to 0.7008) and USDJPY gained 2.39% (154.22 to 157.90), so AUDJPY rose 9.66%, from 100.91 to 110.66. Both pairs rising together is the risk on pattern, even though their day to day correlation stayed negative over the year.
Policy rates sit behind part of that gap. The RBA raised its cash rate target by 25 basis points to 4.60% on September 29, 2026 (see the RBA September decision), while the Bank of Japan kept its overnight call rate target at around 1.25% on October 30 by an 8 to 1 vote (see the BoJ statement on monetary policy). The Fed held the federal funds target range at 3.75% to 4% on October 28, with two members preferring a hike (see the FOMC statement).
What to watch the week of November 2, 2026
This article was written before these events, so it does not report their outcomes. It tells you which leg of the pair each one hits, so you know what a move in one pair says about the other.
| Date | Event | Leg it hits | What it usually does to the link |
|---|---|---|---|
| Tue Nov 3 | RBA decision, 2:30 pm Sydney | Australian dollar | AUDUSD moves, USDJPY mostly ignores it |
| Tue Nov 3 | US midterm elections | US dollar and risk appetite | Dollar moves push the pairs apart, risk moves push them together |
| Fri Nov 6 | US jobs report, 8:30 am ET | US dollar | Usually opposite moves (negative link) |
| Tue Nov 10 | BoJ Summary of Opinions (October meeting) | Japanese yen | USDJPY moves, AUDUSD mostly ignores it |
RBA decision, November 3
The RBA Monetary Policy Board meets on November 2 and 3, 2026 (see the RBA board meeting schedule), and the decision is announced at 2:30 pm Sydney time on November 3, which is 4:30 am in Paris and 10:30 pm ET on November 2. By the time this article is live, the statement is out. Read it first, then check how AUDUSD reacted compared with USDJPY. A big AUDUSD move with a flat USDJPY is an Australian dollar story, and it should not change how you view the yen.
US midterm elections, November 3
Tuesday, November 3, 2026 is the US federal general election date (see the FEC election information page). Results arrive from the evening of November 3 in New York, which is the morning of November 4 in Sydney and Tokyo, when both the Australian dollar and the yen are active. If markets read the result through the dollar, AUDUSD and USDJPY tend to split. If they read it through risk appetite, the two can move up or down together, the way they did in October.
US jobs report, November 6
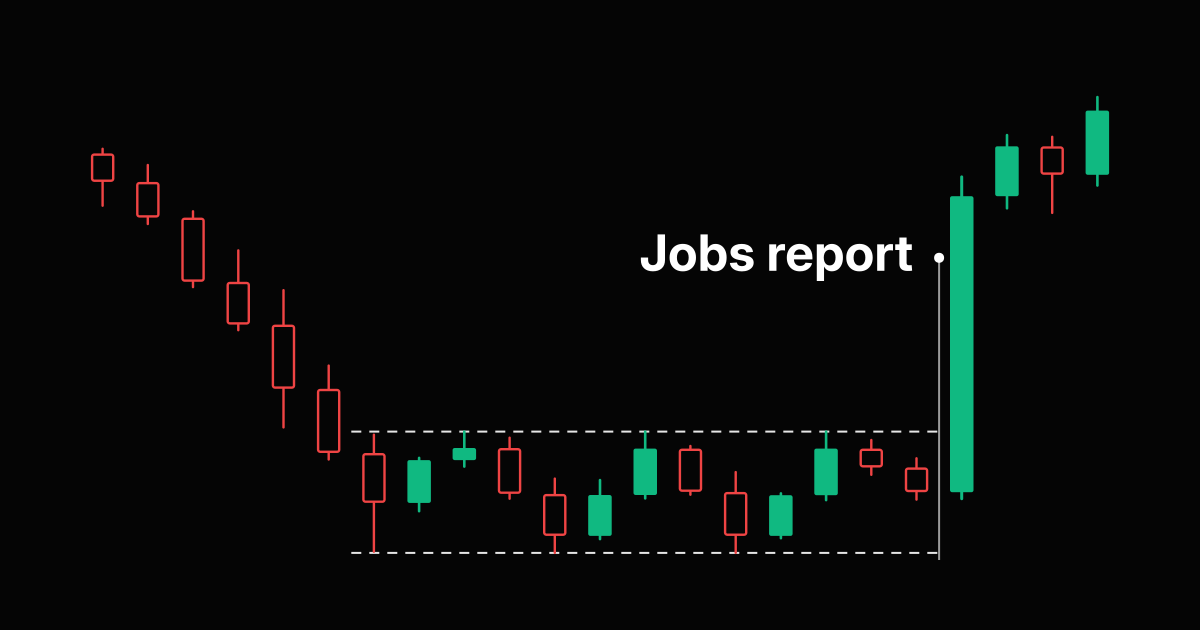
The October Employment Situation report is scheduled for Friday, November 6, 2026 at 8:30 am ET, 2:30 pm in Paris (see the BLS release schedule). It is a dollar event first. A surprise usually pushes AUDUSD and USDJPY in opposite directions, which is the negative link showing up in a single afternoon.
Bank of Japan follow up, November 10
The Summary of Opinions from the October 29 and 30 BoJ meeting is due on November 10 at 8:50 am Tokyo time (see the BoJ meeting schedule). It gives detail on board views and can move the yen leg. More background on the yen side is in the USDJPY correlation guide.
AUDUSD vs USDJPY side by side
| Measure | AUDUSD | USDJPY | AUDJPY |
|---|---|---|---|
| Rate on Nov 2, 2026 | 0.7008 | 157.90 | 110.66 |
| Average daily move, 3 months | 20.4 pips | 49.1 pips | 44.5 pips |
| Median daily move, 3 months | 17.4 pips | 33.0 pips | 32.8 pips |
| Average daily move, 1 year | 26.0 pips | 51.4 pips | 46.5 pips |
| Median daily move, 1 year | 19.7 pips | 34.0 pips | 36.6 pips |
| Daily volatility, 3 months | 0.39% | 0.47% | 0.54% |
| Daily volatility, 1 year | 0.48% | 0.48% | 0.57% |
| Pip value per 1.0 lot | $10 | about $6.33 | about $6.33 |
USDJPY moves about two to two and a half times as many pips a day as AUDUSD, but a yen pip is worth less: 1,000 yen per 1.0 lot, about $6.33 at 157.90. AUDUSD is quoted in dollars, so its pip is a flat $10 per lot. Over one year both pairs had the same 0.48% daily volatility, and AUDJPY was the most volatile of the three at 0.57%.
How much risk you stack trading both
Two positions that each risk 1% swing together like one bigger position when they are correlated. The combined swing is the square root of (2 + 2 times the correlation), in units of one position's risk. With a negative correlation, the direction you trade matters a lot.
| Positions | Correlation used | Behaves like |
|---|---|---|
| Long AUDUSD and short USDJPY (both short the dollar) | -0.30 (1 year) | about 1.61% of risk |
| Long AUDUSD and short USDJPY (both short the dollar) | -0.21 (3 months) | about 1.56% of risk |
| Long AUDUSD and long USDJPY (close to long AUDJPY) | -0.21 (3 months) | about 1.26% of risk |
| Long AUDUSD and long USDJPY (close to long AUDJPY) | +0.22 (1 month) | about 1.56% of risk |
Selling the dollar on both charts is mostly one dollar trade, so it stacks risk. Buying both looks like a hedge on the long run numbers, but in a month like October, when the correlation turned positive, the same two trades behaved like 1.56% of risk instead of 1.26%. Use the shortest window that covers your holding period, not only the one year value. The guide to using correlation in forex covers the general rule.
Lot sizing AUDUSD and USDJPY
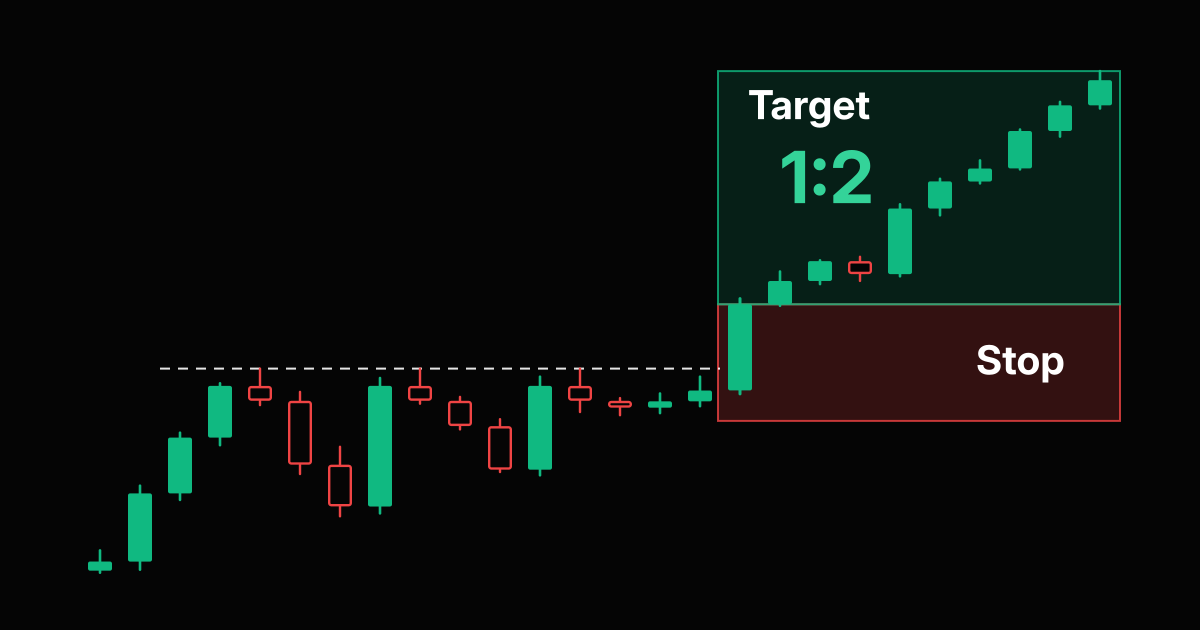
Lots = risk in dollars divided by (stop in pips times pip value). The table uses 1% risk, a 20 pip stop on AUDUSD ($10 per pip per lot) and a 35 pip stop on USDJPY (about $6.33 per pip per lot at 157.90), close to each pair's one year median daily move, rounded down to 0.01 lot.
| Account | 1% risk | AUDUSD, 20 pip stop | USDJPY, 35 pip stop |
|---|---|---|---|
| $1,000 | $10 | 0.05 lot ($10) | 0.04 lot (about $9) |
| $5,000 | $50 | 0.25 lot ($50) | 0.22 lot (about $49) |
| $10,000 | $100 | 0.50 lot ($100) | 0.45 lot (about $100) |
| $25,000 | $250 | 1.25 lots ($250) | 1.12 lots (about $248) |
If both trades are the same dollar idea on a $10,000 account, splitting one $100 budget gives 0.25 lot on AUDUSD ($50) and 0.22 lot on USDJPY (about $49). Check your own numbers with the AUDUSD lot size calculator, the USDJPY lot size calculator or the position size calculator. The USDJPY and GBPJPY lot size guide explains the yen pip math in detail.
A five step check before trading both
- Open the AUDUSD vs USDJPY correlation page and compare the 1M and 3M values with 1Y.
- Name the leg: dollar, Australian dollar or yen. Each event this week hits a different one.
- Check AUDJPY: if it moves strongly, the move is about risk appetite, not the dollar.
- If both trades sell the dollar, give them one risk budget and split it.
- Size each leg from its own stop: $10 per pip on AUDUSD, about $6.33 per pip on USDJPY at 157.90.
Before you size, check the payoff with the risk reward calculator.
Frequently Asked Questions
Are AUDUSD and USDJPY correlated?
Weakly and usually negatively. On ECB reference rates to November 2, 2026, the correlation of daily returns was -0.21 over three months, -0.27 over six months, -0.30 over one year and -0.33 over two years. Over one month it turned positive at +0.22.
Why are AUDUSD and USDJPY negatively correlated?
Because the US dollar sits on opposite sides of the two pairs. A stronger dollar pushes AUDUSD down and USDJPY up. Risk appetite pulls the other way: risk on lifts the Australian dollar and weakens the yen, so both pairs rise. Over the last two years the dollar effect has won most of the time.
What is the link between AUDUSD, USDJPY and AUDJPY?
AUDUSD times USDJPY equals AUDJPY. On November 2, 2026, 0.7008 times 157.90 gives 110.66. Being long AUDUSD and long USDJPY together is close to being long AUDJPY, because the dollar cancels out.
Which moves more, AUDUSD or USDJPY?
USDJPY moves more pips: an average of 49.1 pips a day over three months against 20.4 for AUDUSD. A yen pip is worth less, about $6.33 per 1.0 lot at 157.90, against $10 on AUDUSD. Over one year both had the same 0.48% daily volatility.
Is it risky to trade AUDUSD and USDJPY at the same time?
It depends on direction. Long AUDUSD and short USDJPY are both dollar shorts, and at the one year correlation of -0.30 two trades risking 1% each swing like about 1.61% of risk. Long both is closer to one AUDJPY trade, about 1.26% at the three month reading, but about 1.56% at the October one month reading of +0.22.
Which events move AUDUSD and USDJPY this week?
The RBA decision at 2:30 pm Sydney time on November 3, 2026, the US midterm elections the same day and the US jobs report at 8:30 am ET on November 6. The RBA hits the Australian dollar leg, the jobs report hits the dollar leg, and the election can hit both the dollar and risk appetite.
Risk Disclaimer: Trading stocks, options, futures, forex, commodities, and cryptocurrencies involves substantial risk of loss and is not suitable for every investor. Past performance does not guarantee future results. This article is for educational purposes only and does not constitute financial advice. You should carefully consider your financial situation and risk tolerance before trading. Never trade with money you cannot afford to lose. Correlation readings change over time and are calculated from daily ECB reference rates, which can differ from your broker's prices.