AUDUSD
AUDUSD vs EURUSD Correlation: How Closely They Move, and When the Link Breaks
AUDUSD and EURUSD usually move in the same direction, because both are quoted against the US dollar. But the link is weaker than most traders assume. On ECB reference rates to October 21, 2026, the correlation of their daily returns was 0.43 over one month, 0.52 over three months, 0.65 over six months and 0.68 over one year. That is a real, positive link, not a copy of the same trade.
This comparison shows where the two pairs agree, where they split, and what that means for your risk when you hold both. Every coefficient below uses the same data and the same calendar windows as the free SIWAI AUDUSD vs EURUSD correlation page, so you can check today's reading before you trade.
Why AUDUSD and EURUSD move together
Both pairs have the US dollar as the quote currency. When the dollar weakens across the board, the price of one euro and the price of one Australian dollar both rise in dollar terms, so both charts go up. When the dollar strengthens, both go down. That shared leg is the whole reason the correlation coefficient between them is usually positive.
The other leg is where they differ. EURUSD carries the euro area and the European Central Bank. AUDUSD carries Australia and the Reserve Bank of Australia, and the Australian dollar has its own driver: the RBA explains in its drivers of the Australian dollar explainer that commodity prices and the terms of trade have a large influence on the currency, which is why it is often called a commodity currency. So a day can be a dollar day (both pairs move together) or a euro or Aussie day (one pair moves on its own).
A coefficient of +1 would mean the daily moves always line up, 0 means no linear link and -1 means they always move opposite. A reading around 0.5 means they agree more often than not, with plenty of days where they do not. In the last three months, AUDUSD and EURUSD closed in the same direction on 49 of 68 ECB fixing days, about 72% of the time.
AUDUSD correlation with EURUSD and the other majors right now
The table compares AUDUSD with EURUSD and five other majors across the four windows on the SIWAI tool. The inputs are ECB euro reference rates (published daily around 16:00 CET, see the ECB reference rates page) loaded through the Frankfurter exchange rate API, converted to dollar pairs, then compared as daily percentage returns. Windows end on October 21, 2026.
| AUDUSD vs | 1 month | 3 months | 6 months | 1 year |
|---|---|---|---|---|
| EURUSD | 0.43 | 0.52 | 0.65 | 0.68 |
| NZDUSD | 0.68 | 0.66 | 0.73 | 0.80 |
| GBPUSD | 0.66 | 0.58 | 0.68 | 0.73 |
| USDCAD | -0.46 | -0.49 | -0.53 | -0.59 |
| USDCHF | -0.13 | -0.37 | -0.53 | -0.58 |
| USDJPY | -0.07 | -0.23 | -0.24 | -0.31 |
Three things stand out:
- EURUSD is not AUDUSD's closest twin. NZDUSD is higher on every window, which makes sense: two commodity linked Pacific currencies share more drivers than the Aussie and the euro. Compare them on the AUDUSD vs NZDUSD page.
- The short windows are weaker than the long ones. The AUDUSD and EURUSD link has faded from 0.68 on one year to 0.43 on one month. Recent behavior is less synchronized than the yearly number suggests.
- The negative readings are the dollar showing up from the other side. In USDCAD, USDCHF and USDJPY the dollar is the base currency, so a weaker dollar pushes those pairs down while AUDUSD rises. See AUDUSD vs USDCAD and AUDUSD vs USDJPY.
AUDUSD vs EURUSD side by side
Correlation tells you how often the two pairs agree. It does not tell you how far each one moves. Here is the rest of the comparison, with the price and volatility figures taken from the same ECB series.
| AUDUSD | EURUSD | |
|---|---|---|
| ECB based rate, Oct 21, 2026 | 0.7034 | 1.1234 |
| Change over the last 3 months | +0.39% | -1.68% |
| Typical daily move, 3 months (standard deviation) | 0.40% | 0.29% |
| Pip value of 1.0 lot (100,000 units) | $10 | $10 |
| Central bank of the base currency | Reserve Bank of Australia | European Central Bank |
| Extra driver beyond the dollar | Commodity prices and terms of trade | Euro area rates and growth |
The two lines that matter most for traders: AUDUSD has been the more volatile pair, with a typical daily move about 1.4 times EURUSD's, and over the last three months the two went in opposite directions. EURUSD fell while AUDUSD finished slightly higher. Both still pay $10 per pip on 1.0 lot because the dollar is the quote currency, so the same stop in pips risks the same money on either pair.
When the AUDUSD and EURUSD link breaks
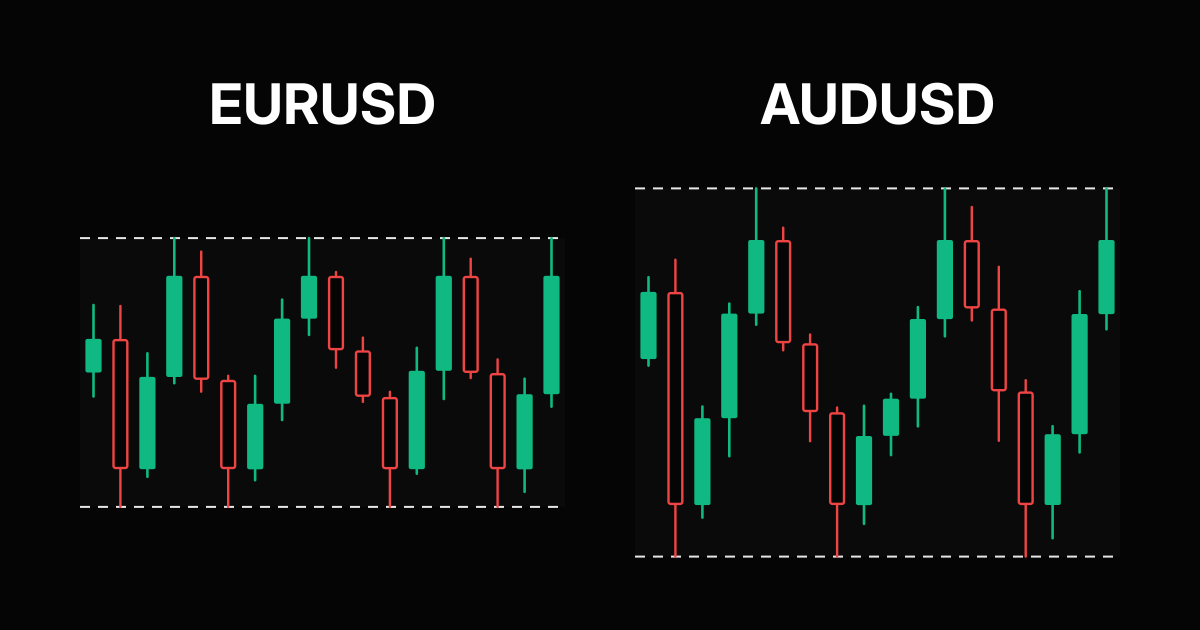
The number moves a lot. Measured on rolling windows of 63 ECB fixing days (about three months), the AUDUSD and EURUSD correlation has ranged from 0.13 in early September 2024 to 0.87 in late June 2026. By October 21, 2026 it was back near 0.52. A trader who learned the pairs in June and assumed they still move as one would be badly surprised today.
| Rolling 3 month reading | Date | Correlation |
|---|---|---|
| Lowest since spring 2024 | Sep 5, 2024 | 0.13 |
| Highest since spring 2024 | Jun 24, 2026 | 0.87 |
| One month before the latest | Sep 17, 2026 | 0.65 |
| Latest | Oct 21, 2026 | 0.52 |
The link tends to weaken when one side has its own story:
- Commodity moves. A swing in iron ore or other export prices can push the Aussie without touching the euro, as the RBA explainer describes.
- Diverging central banks. An RBA or ECB decision, or a shift in what markets expect from either, moves one leg alone. The RBA publishes its cash rate target history and the ECB its key interest rates.
- Regional data surprises. Australian jobs or inflation numbers, or a euro area growth or inflation release, are single leg events.
The link tends to strengthen when the US dollar itself is the story, for example on US inflation, jobs or Federal Reserve days (the Fed's FOMC page lists its decisions). On those days both pairs often react to the same number, which is why our CPI day chart setups treat the dollar pairs as one theme.
Holding both: how much risk you really stack
Say you buy AUDUSD and EURUSD at the same time, each sized to risk 1% of your account. If both stops are hit, you lose 2%. Correlation does not change that worst case. What it changes is how often the two positions win and lose together, and so how much your account swings.
For two positions with equal risk, the swing of the combined position grows with the square root of 2 + 2 × correlation, in units of one position's risk. At the readings above:
| Correlation | When | Combined swing of 1% + 1% |
|---|---|---|
| 0.13 | Rolling low, Sep 2024 | about 1.50% |
| 0.52 | 3 months to Oct 21, 2026 | about 1.74% |
| 0.87 | Rolling high, Jun 2026 | about 1.93% |
| 1.00 | Perfect twins | 2.00% |
At today's 0.52, two 1% trades behave like about 1.74% of risk, not 1%. At June's 0.87 they were almost one 2% bet. The practical rule: if you want one dollar view across both pairs, give the idea one risk budget and split it, instead of risking your full amount on each. The guide to using currency correlation in forex covers the same stacking logic for EURUSD, GBPUSD and USDCHF.
Sizing AUDUSD and EURUSD from one risk budget
Both pairs pay $10 per pip on 1.0 lot, $1 on 0.10 lot and $0.10 on 0.01 lot, so the formula is the same: lots = risk money ÷ (stop in pips × $10). Example with a $10,000 account and a 1% budget of $100:
| Plan | AUDUSD (30 pip stop) | EURUSD (25 pip stop) | Total at risk |
|---|---|---|---|
| Full 1% on each | 0.33 lot ($99) | 0.40 lot ($100) | $199 |
| One 1% budget, split 50/50 | 0.16 lot ($48) | 0.20 lot ($50) | $98 |
| Only the cleaner chart | 0.33 lot ($99) | none | $99 |
Lots are rounded down to the 0.01 step, so the dollar risk is never above plan. Run your own stops in the AUDUSD lot size calculator and the EURUSD lot size calculator, or the position size calculator for any pair. The full method, including accounts that are not in dollars, is in how to calculate lot size in forex.
Using EURUSD to read an AUDUSD breakout
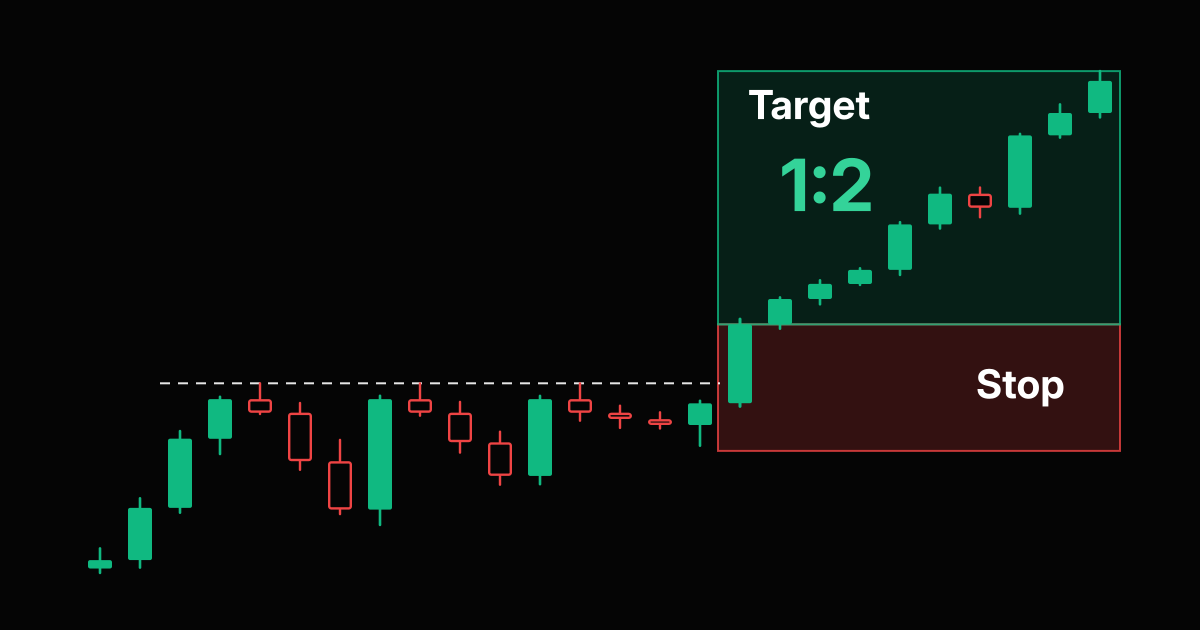
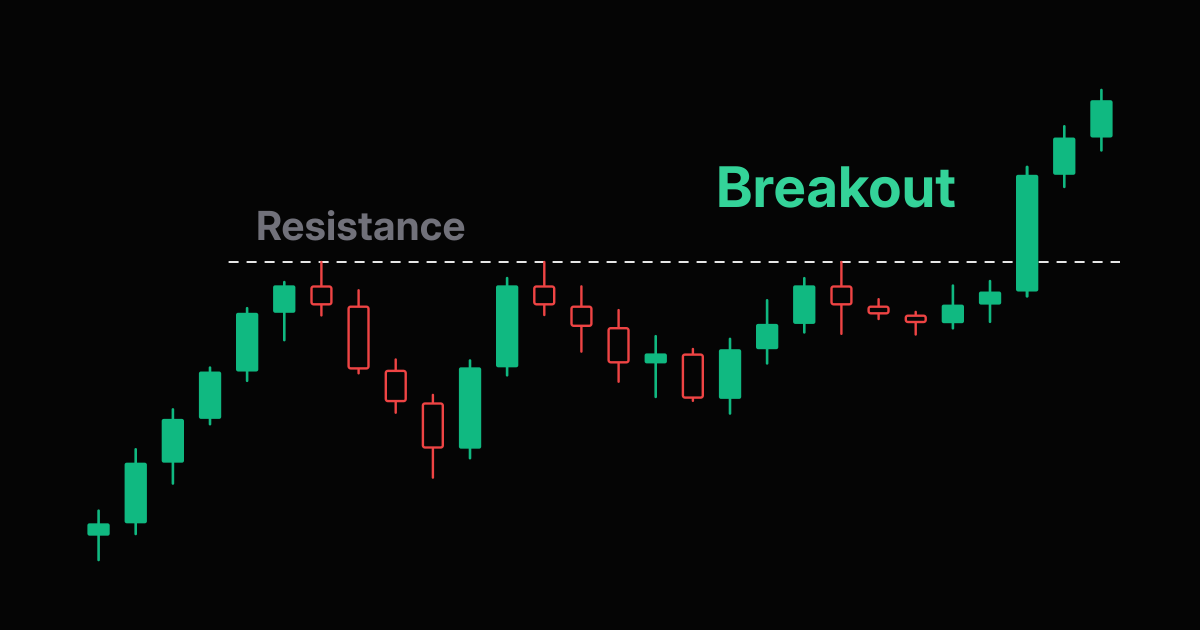
Correlation is most useful as a question, not a signal. When AUDUSD closes above a clear resistance line, look at EURUSD on the same timeframe:
- EURUSD breaking out too: the move is probably about the US dollar. You have one idea on two charts. Pick the cleaner one or split one risk budget.
- EURUSD flat or falling: the move is probably about the Aussie itself. That can be a fine trade, but the EURUSD chart tells you nothing about it, and it will not hedge it either.
- Correlation reading below about 0.3 on the window you trade: treat the two pairs as separate markets and size each on its own.
None of this makes a breakout more likely to work. It tells you what you are betting on, so you do not bet on it twice by accident. Check the payoff before you size with the risk reward calculator.
A five step check before trading AUDUSD and EURUSD together
- Open the AUDUSD vs EURUSD correlation and read the 1M and 3M tabs, not only the 1Y.
- Decide whether your idea is about the US dollar, the euro or the Aussie.
- If it is a dollar idea, give it one risk budget across both pairs.
- Size each leg from its own stop in pips at $10 per pip per 1.0 lot.
- Check the calendar for US, euro area and Australian releases, and rerun the correlation after big events. The forex correlation matrix shows every major pair at once.
Frequently Asked Questions
Are AUDUSD and EURUSD positively correlated?
Yes, usually. Both are quoted against the US dollar, so a broad dollar move pushes them the same way. On ECB reference rates to October 21, 2026, the correlation of daily returns was 0.43 over one month, 0.52 over three months, 0.65 over six months and 0.68 over one year.
How strong is the AUDUSD and EURUSD correlation?
Moderate and unstable. On rolling three month windows it ranged from 0.13 in September 2024 to 0.87 in June 2026, and stood near 0.52 on October 21, 2026. Check the live reading on the SIWAI AUDUSD vs EURUSD correlation page before you trade both.
Which pair is most correlated with AUDUSD?
Among the majors, NZDUSD. Its correlation with AUDUSD was 0.66 over three months and 0.80 over one year to October 21, 2026, higher than EURUSD on every window. Both are commodity linked Pacific currencies quoted against the dollar.
Why do AUDUSD and EURUSD sometimes move in opposite directions?
Because each pair also carries its own currency. Commodity prices, RBA decisions and Australian data move the Aussie, while ECB decisions and euro area data move the euro. Over the three months to October 21, 2026, EURUSD fell 1.68% while AUDUSD rose 0.39%.
Should I trade AUDUSD and EURUSD at the same time?
You can, but if both trades express the same US dollar view, give the idea one risk budget and split it. At a correlation of 0.52, two trades risking 1% each swing like about 1.74% of risk, and if both stops are hit you still lose 2%.
Is the pip value the same on AUDUSD and EURUSD?
Yes. Both have the US dollar as the quote currency, so 1.0 lot (100,000 units) pays $10 per pip, 0.10 lot pays $1 and 0.01 lot pays $0.10. The same stop in pips risks the same dollars on either pair.
Risk Disclaimer: Trading stocks, options, futures, forex, commodities, and cryptocurrencies involves substantial risk of loss and is not suitable for every investor. Past performance does not guarantee future results. This article is for educational purposes only and does not constitute financial advice. You should carefully consider your financial situation and risk tolerance before trading. Never trade with money you cannot afford to lose. Correlation readings change over time and are calculated from daily ECB reference rates, which can differ from your broker's prices.