forex correlation
How to Use Currency Correlation in Forex: Pairs That Move Together, and Pairs That Cancel Out
Currency correlation tells you whether two forex pairs tend to move in the same direction or in opposite directions. Positive correlation means the pairs often rise and fall together. Negative correlation means one often rises when the other falls. Near zero means there is no reliable relationship over the window you measured.
Traders use that read to avoid stacking the same dollar bet twice, to spot accidental hedges, and to size risk across a book of pairs. This guide explains how to use correlation in forex with concrete pair examples, then ties the idea to position sizing. For live coefficients, open the free SIWAI forex correlation tool. Do not treat any number in this article as a forecast. Correlations change with rates, risk sentiment, and the lookback window.
What currency correlation means in forex
A forex pair is a price of one currency quoted in another. Wikipedia's overview of a currency pair is the clean starting point: EURUSD rises when the euro strengthens against the dollar, and falls when the dollar strengthens against the euro. Correlation compares how the returns of two pairs move together over a chosen window, not whether their absolute prices sit at similar levels.
Brokers and education desks usually describe the coefficient on a scale from plus 1 to minus 1. IG's trader's guide to currency pair correlations frames the idea the same way: positive correlation means the pairs move in tandem, negative means they move in opposite directions, and weak readings mean the relationship is unreliable for that window. Corporate Finance Institute's note on currency correlation stresses the same point for portfolio risk: correlated legs can amplify a single theme even when the ticket symbols look different.
How to read the scale (qualitative)
Near +1: the pairs usually move the same way over the window
Near 0: no stable relationship over that window
Near minus 1: the pairs usually move opposite ways over the window
Thresholds for "strong" vary by desk. Always check the live matrix for the window you trade, because a one month reading can disagree with a one year reading.
SIWAI shows rolling correlations on the matrix and on pair pages such as EURUSD vs USDJPY. Use those pages for current numbers. This article stays qualitative so it does not invent a coefficient that will be stale tomorrow.
Pairs that often move together
The classic positive example is EURUSD and GBPUSD. Both quote a European currency against the US dollar. A broad dollar move hits both tickets at once. Europe and the UK also share trade, rates expectations, and risk sentiment more often than not, so the euro and the pound frequently lean the same way against the dollar. IG highlights EURUSD and GBPUSD as a highly correlated pair for that reason. The relationship is common, not guaranteed. Sterling specific news, Bank of England surprises, or a euro area shock can weaken the link for days or weeks.
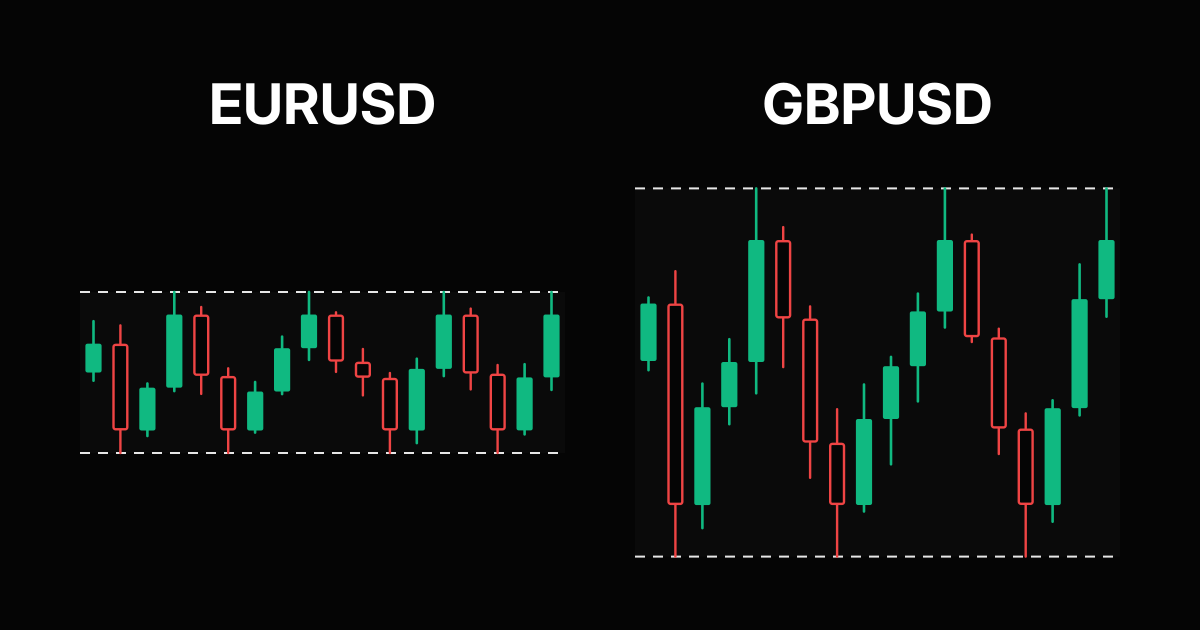
Other pairs that often show positive correlation include AUDUSD and NZDUSD. Australia and New Zealand are commodity linked economies with close trade ties to each other and to China demand themes. You can inspect that relationship on AUDUSD vs NZDUSD. Crosses that share a leg can also move together: EURJPY and GBPJPY both carry yen exposure, so a sharp yen move can push both in the same direction even when EURUSD and GBPUSD are quiet.
Practical takeaway: if you are long EURUSD and long GBPUSD with separate "1% risk" tickets, you may be running closer to one short dollar theme at roughly double the size. Check EURUSD vs GBPUSD before you treat those tickets as independent.
Pairs that often cancel each other out
Negative correlation shows up when the dollar sits on opposite sides of the quote. EURUSD rises when the dollar weakens. USDCHF rises when the dollar strengthens against the franc. A strong dollar move therefore tends to push those two pairs in opposite directions. IG notes that EURUSD and USDCHF often show a strong historical negative relationship for that structural reason. The same dollar on opposite sides logic appears when you compare many XXXUSD pairs with USDYYY pairs.
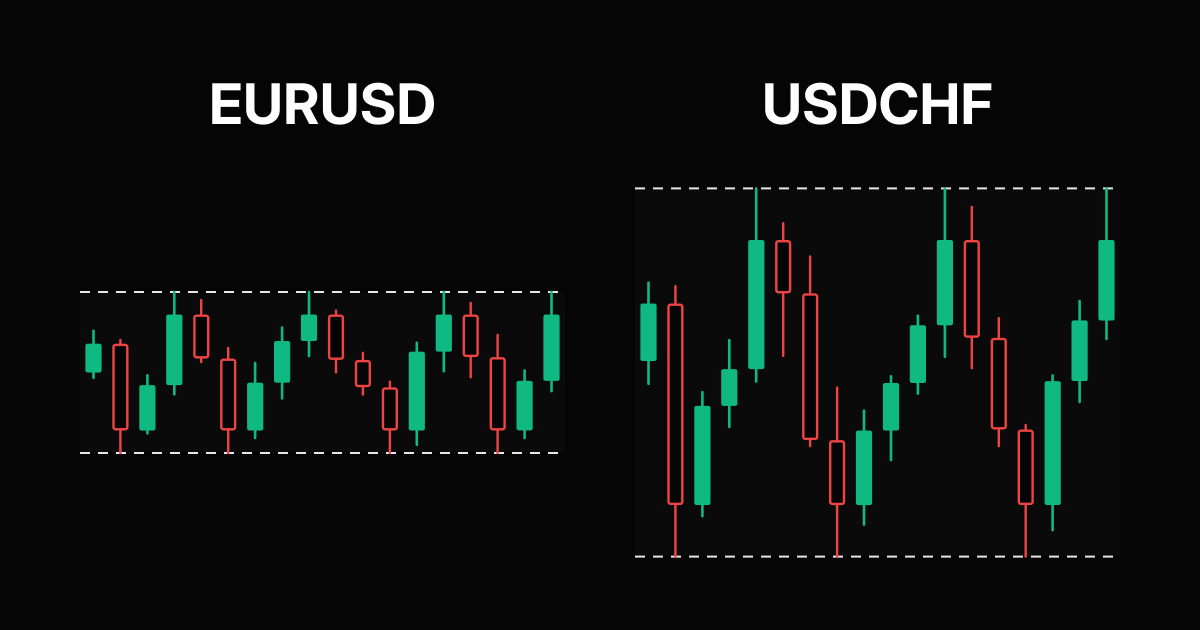
That structure can create an accidental hedge. Long EURUSD and long USDCHF with a strong negative correlation can leave you paying two spreads for little net dollar exposure. The opposite also happens: traders sometimes open the second ticket on purpose as a short term hedge when they want to keep inventory but reduce overnight dollar risk. Either way, the matrix should drive the decision, not memory of "how these pairs usually behave."
EURUSD and USDJPY are another pair traders watch closely. The link is less structural than EURUSD and USDCHF, because USDJPY also embeds Japan rates, intervention risk, and risk on or risk off flows. Some windows show a clear inverse read. Others weaken toward zero. That is exactly why the EURUSD vs USDJPY tool page matters more than a static table in a blog post.
How traders use correlation without inventing edge
Correlation is a risk lens first. It does not tell you which pair will break out, and it does not replace a chart setup. Use it in three practical ways.
1. Avoid doubling the same theme
If two setups you like sit on pairs with strong positive correlation, cut size on each, pick the cleaner chart, or skip one. Stacking EURUSD and GBPUSD longs after a dollar headline is the usual trap.
2. Spot accidental hedges
If you are long one pair and long another with strong negative correlation, your P&L may cancel while spreads still clear. Either hedge on purpose with a written plan, or flatten the weaker ticket.
3. Size the book, not only the ticket
Decide a maximum dollar risk for the theme (for example short dollar), then allocate that budget across correlated tickets. The lot calculator still sizes each stop. Correlation decides how much of the budget each ticket may take.
Cross pairs need the same check. GBPJPY and GBPUSD share sterling exposure. A long GBPJPY and long GBPUSD book loads sterling twice if you treat them as independent. Review GBPJPY vs GBPUSD before you stack those tickets.
Tie correlation to lot size and risk reward
Correlation answers "how related are these tickets." Lot size answers "how many units may I trade if this stop is hit." You need both. The formula stays the same as in our lot size guide: choose a risk percent of equity, measure stop distance, convert pip or point value, then solve for lots. Worked tables for small accounts live in how many lots with $100, $500 or $1,000.
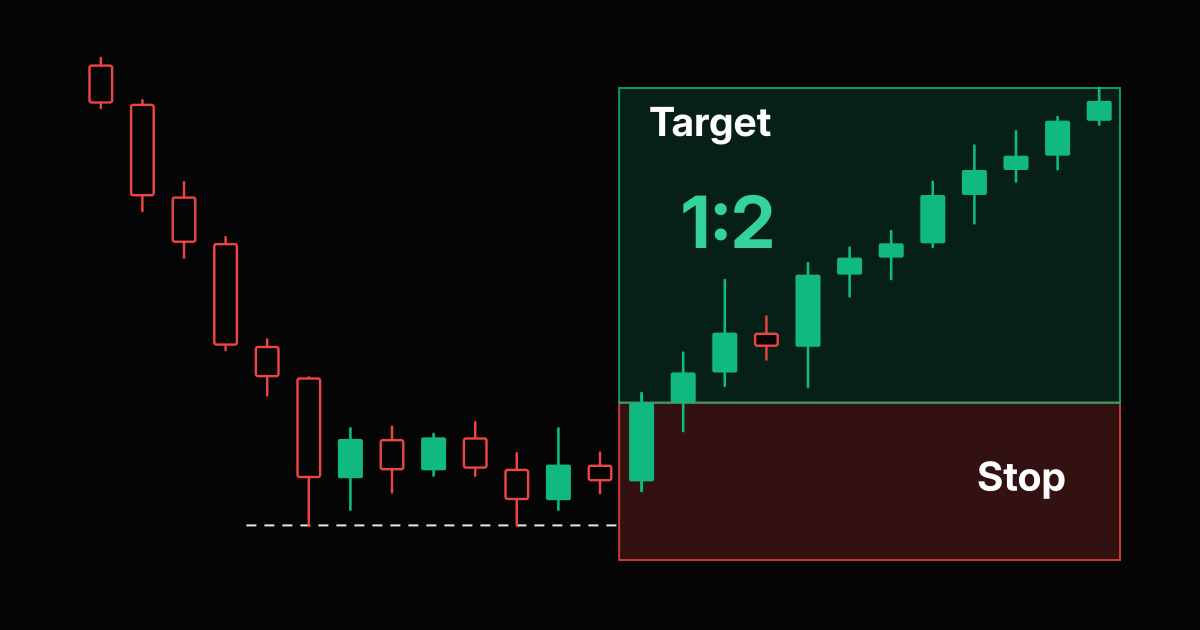
Worked example without inventing a coefficient. Suppose your rule is 1% account risk per theme, not per ticket. You want a long EURUSD breakout and a long GBPUSD breakout on the same session. Open the correlation matrix. If the live reading is strongly positive, treat the two tickets as one theme: split the 1% budget (for example 0.5% each), or take only the cleaner chart at full 1%. Size each chosen ticket with the EURUSD lots calculator or USDJPY lots calculator using that ticket's own stop distance.
Index CFDs follow the same book thinking when you compare related markets. SIWAI uses $1 per point per 1.0 lot on US30, NAS100, and SPX500. Volatility still differs across those indices, which is why our US30 vs NAS100 comparison focuses on range and sizing, not on a single shared lot number.
A simple correlation checklist before you click buy
1. List every open or planned forex ticket for the session
2. Open the SIWAI matrix and the pair pages for each combination you hold
3. Mark strongly positive links as one theme, not separate bets
4. Mark strongly negative links as possible hedges, intentional or not
5. Set one dollar risk budget for each theme, then size lots from each stop
6. Recheck after major data: CPI, NFP, and central bank days often shift readings
Candle confirmation still matters on each chart. Pattern location, invalidation, and next bar closes are separate skills. Our inverted hammer vs shooting star guide covers that chart side. Correlation only answers whether two confirmed setups belong in the same risk bucket.
Frequently Asked Questions
What is currency correlation in forex?
Currency correlation measures whether two forex pairs tend to move in the same direction or opposite directions over a chosen window. Positive readings mean they often move together. Negative readings mean they often move opposite. Near zero means the relationship is unreliable for that window.
Which forex pairs are positively correlated?
EURUSD and GBPUSD are a common positive example because both quote against the US dollar and often react to the same dollar themes. AUDUSD and NZDUSD often move together for commodity and regional reasons. Always confirm on a live matrix because the strength changes by window.
Which forex pairs are negatively correlated?
EURUSD and USDCHF often show negative correlation because the dollar sits on opposite sides of the quote. A stronger dollar tends to push EURUSD down and USDCHF up. Treat that as a structural tendency, then verify the live reading before you hedge.
How do traders use forex correlation?
Use it to avoid doubling the same theme across tickets, to spot accidental hedges, and to allocate one risk budget across correlated pairs. Correlation does not replace chart setups or stop placement.
Does correlation replace lot size calculation?
No. Correlation decides how related two tickets are. Lot size still comes from account risk, stop distance, and pip or point value. Use SIWAI lots calculators for EURUSD, USDJPY and other pairs after you set the theme budget.
Where can I check live EURUSD USDJPY correlation?
Open the SIWAI forex correlation tool and the EURUSD vs USDJPY pair page for current coefficients. Blog text stays qualitative so it does not invent a stale number.
Risk Disclaimer: Trading stocks, options, futures, forex, and cryptocurrencies involves substantial risk of loss and is not suitable for every investor. Past performance does not guarantee future results. This article is for educational purposes only and does not constitute financial advice. You should carefully consider your financial situation and risk tolerance before trading. Never trade with money you cannot afford to lose.