index trading
US30 vs NAS100: Which Index Should You Trade, and How to Size Each Position
US30 and NAS100 are two of the most actively traded index instruments in the world, but they are not interchangeable. The first tracks 30 blue-chip industrial companies using a price-weighted method. The second tracks 100 of the largest non-financial Nasdaq-listed companies using modified market cap weighting. Choosing between them depends on what you want to trade, how volatile you expect the move to be, and how you size the position.
This guide compares US30 and NAS100 directly: what each index tracks, how they are weighted, what volatility character to expect, how pip and point values work, and worked examples for position sizing each instrument using the lot size calculators.
What US30 and NAS100 actually track
US30 is the broker shorthand for the Dow Jones Industrial Average, an index of 30 large United States companies. The 30 names are hand-picked by a committee and are meant to represent the broad U.S. economy. Despite the name "Industrial Average," the index no longer focuses only on industrial companies. It excludes transportation and utility stocks, which have their own separate Dow indices, but it covers most other sectors.
The index is price-weighted, which means a higher-priced stock has more influence on the index value than a lower-priced one, regardless of company size. A $300 stock moves the index more than a $50 stock even if the $50 company has a larger market cap. That price weighting makes the US30 unusual compared to most modern indices, which are market cap weighted.
NAS100 refers to the Nasdaq-100, an index of 100 of the largest non-financial companies primarily listed on the Nasdaq Stock Market. According to the Nasdaq-100 Index methodology, eligibility requires at least $5 million in average daily traded value over three months. Financial companies, REITs, and SPACs are excluded. The index is weighted by modified market capitalization, so larger companies carry more weight, but adjustments are made to prevent extreme concentration in a single name.
The Nasdaq-100 is heavily concentrated in technology, consumer services, and health care. As of 2026, the index includes many of the largest technology companies in the world, which means moves in the tech sector have an outsized effect on the index. That concentration is both the reason traders are drawn to it and the reason it can move fast.
How composition and weighting affect the trade
The number of constituents and the weighting method shape how each index behaves. US30 has only 30 names, so a large move in one high-priced stock can shift the entire index. A single earnings miss or beat in a $400 stock can move US30 by dozens of points. The small number of constituents also means sector rotation can show up quickly. If industrials are weak and tech is strong, the index will reflect that within a limited sample.
NAS100 has 100 names and uses modified market cap weighting, so the largest companies by market value drive most of the index movement. When the top five names move together, they can carry the entire index. When they diverge, the index can feel choppy even if the majority of constituents are moving in one direction. That concentration is visible in both upward and downward moves.
The practical difference for traders is that US30 can be influenced by individual stock headlines in ways that feel disconnected from the broader market, while NAS100 often moves as a proxy for big tech. Neither is more predictable than the other. They just respond to different drivers.
| Feature | US30 | NAS100 |
|---|---|---|
| Number of constituents | 30 companies | 100 companies |
| Weighting method | Price-weighted | Modified market cap weighted |
| Sector focus | Broad economy, excludes transport and utilities | Heavy tech, consumer services, health care |
| Influence drivers | High-priced stocks move the index more | Largest market cap companies move the index more |
Volatility character and typical daily ranges
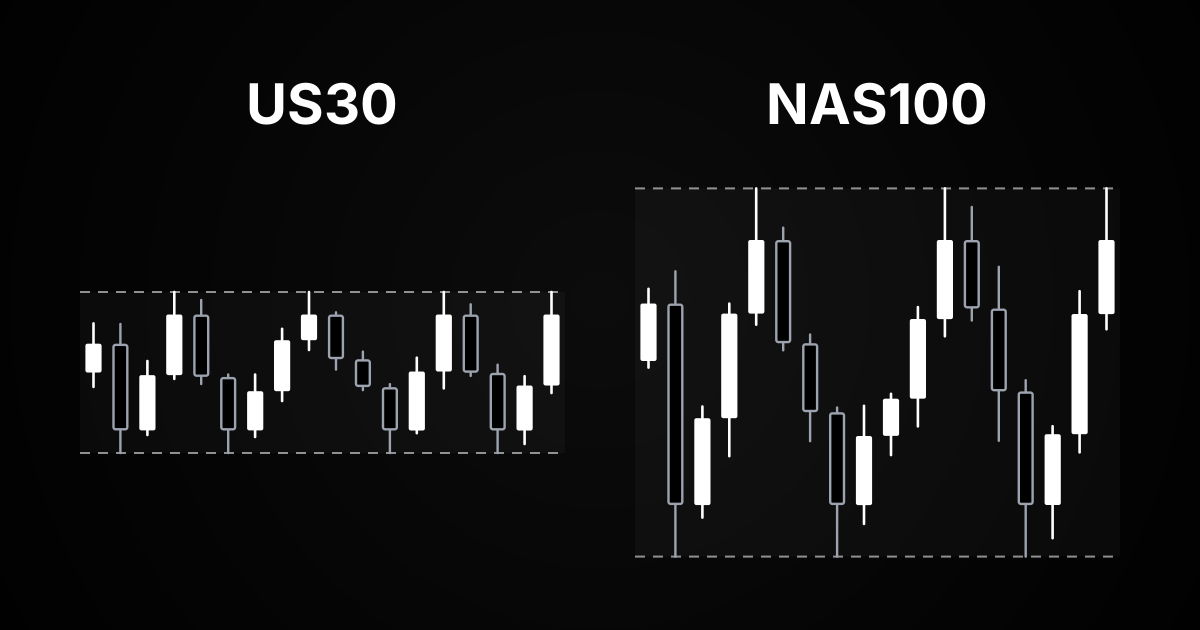
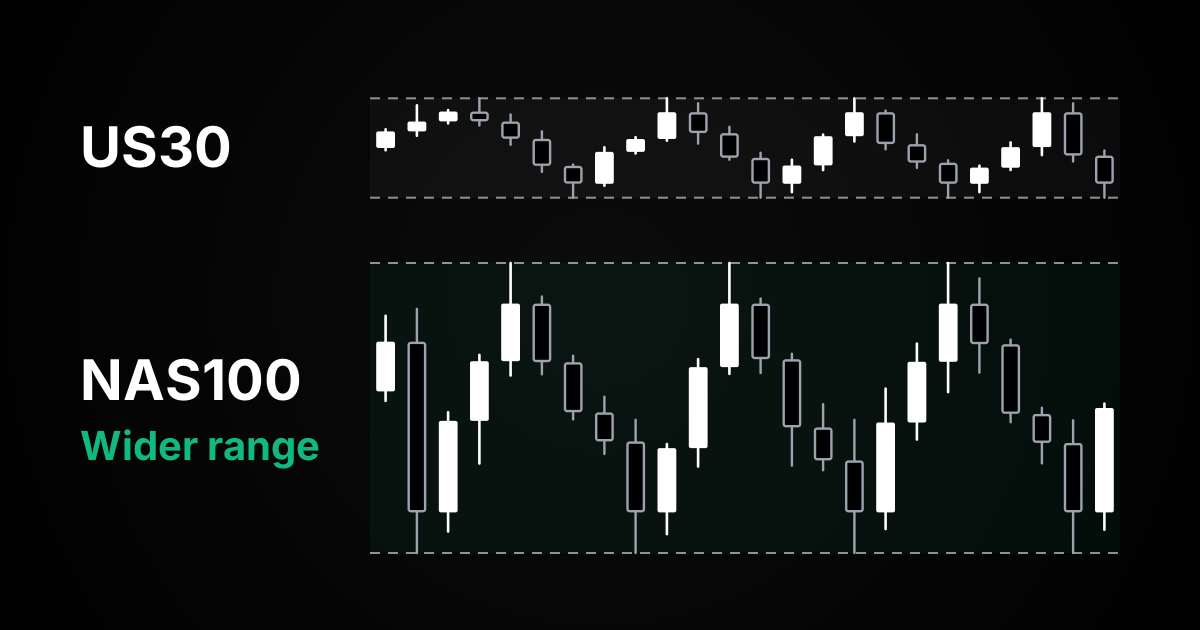
NAS100 is generally more volatile than US30. The tech-heavy composition and smaller average company age mean earnings surprises, regulatory headlines, and interest rate expectations can move the index sharply. Intraday swings of 200 to 300 points are not unusual during earnings season or Federal Reserve announcements. On quiet days, the range can tighten to under 100 points.
US30 tends to have narrower daily ranges. The blue-chip composition and diversified sector exposure dampen individual stock moves. A typical day might see a range of 200 to 400 points, and even volatile sessions often stay under 600 points unless a major macro event is in play. The smaller range makes the index easier to size for traders with lower risk tolerance, but it also means targets need to be realistic relative to average movement.
Neither index is always calm or always wild. Volatility clusters. When markets are pricing in uncertainty, both indices will move more. The difference is that NAS100 usually moves first and farther, while US30 tends to lag and show a more measured response. Use that difference to decide which instrument fits your target and stop distance.
How much is 1 pip in Nasdaq and Dow
Understanding pip and point values is required before you can size a position correctly. For index CFDs and futures, the term "pip" is often used interchangeably with "point," but the cash value per point depends on the contract or lot size your broker offers. There is no universal standard. CFD brokers vary widely in their contract sizes, and futures contracts differ from CFD conventions.
SIWAI calculator convention
The SIWAI lots calculator uses a consistent convention across indices: $1 per point per 1.0 lot. This matches many retail CFD brokers but not all. If your broker uses a different contract size, adjust the examples below accordingly. Always verify your broker's contract specifications before trading.
SIWAI calculator point values (CFD convention)
US30: $1 per point per 1.0 lot
NAS100: $1 per point per 1.0 lot
SPX500: $1 per point per 1.0 lot
Broker contract sizes vary. Check your platform's specifications.
CME futures contract values
CME Group offers E-mini index futures with different multipliers. According to CME E-mini Nasdaq-100 contract specifications, one NQ contract is valued at $20 times the index. The CME E-mini Dow (YM) contract is $5 times the index. The E-mini S&P 500 is $50 times the index.
CME E-mini futures (per contract)
E-mini Dow (YM): $5 per index point
E-mini Nasdaq-100 (NQ): $20 per index point
E-mini S&P 500 (ES): $50 per index point
These are futures contracts, not CFD lots. Contract sizes differ from typical CFD brokers.
The worked examples below use the SIWAI calculator convention of $1 per point per 1.0 lot, since that matches the calculators linked in this article. If you are trading CME futures or a broker with different contract sizes, scale the lot size accordingly.
Position sizing worked examples for US30 and NAS100
Position sizing should always start from the distance to your stop, not from how confident you feel about the trade. Use a position size calculator or work through the math manually. The following examples assume a 2% account risk rule, meaning you are willing to lose 2% of your account if the stop is hit.
US30 position sizing example
You have a $10,000 account. You are buying US30 at 40,000 with a stop at 39,900. Your broker uses the SIWAI calculator convention of $1 per point per 1.0 lot.
- Stop distance: 40,000 minus 39,900 equals 100 points
- Max risk: 2% of $10,000 equals $200
- Point value at 1.0 lot: $1 per point
- Risk per lot: 100 points × $1 equals $100
- Lot size: $200 ÷ $100 equals 2.0 lots
At 2.0 lots, the position risks $200 if the stop at 39,900 is hit. Use the US30 lot size calculator to run the calculation for your own numbers. If your broker uses a different contract size, the lot size will scale proportionally.
US30 sizing summary
Account: $10,000
Risk: 2% = $200
Stop distance: 100 points
Point value: $1 per point per 1.0 lot
Lot size: 2.0 lots
NAS100 position sizing example
Same $10,000 account. You are buying NAS100 at 20,000 with a stop at 19,900. Using the same $1 per point per 1.0 lot convention.
- Stop distance: 20,000 minus 19,900 equals 100 points
- Max risk: 2% of $10,000 equals $200
- Point value at 1.0 lot: $1 per point
- Risk per lot: 100 points × $1 equals $100
- Lot size: $200 ÷ $100 equals 2.0 lots
At 2.0 lots, the position risks $200 if the stop at 19,900 is hit. With the same $1 per point convention, the lot size is the same for both indices when the stop distance and risk are identical. Use the NAS100 lot size calculator to check the math before you enter.
NAS100 sizing summary
Account: $10,000
Risk: 2% = $200
Stop distance: 100 points
Point value: $1 per point per 1.0 lot
Lot size: 2.0 lots
When using the same point value convention, the lot size calculation is identical for equal stop distances and risk. If your broker uses different contract sizes for US30 versus NAS100, you must account for that difference when sizing. Always verify your broker's specifications.
Should you also consider SPX500?
SPX500, the S&P 500 index, is a third option. It tracks 500 large-cap U.S. companies using float-adjusted market cap weighting, making it broader than both US30 and NAS100. The S&P 500 is often considered the benchmark for U.S. equities because of its size and diversification.
SPX500 sits between US30 and NAS100 in terms of volatility. It is more stable than NAS100 because it includes financials, energy, and other sectors that dampen tech concentration. It is more volatile than US30 because it includes 500 names instead of 30, which means more sector and individual company risk is priced in. The SIWAI calculator uses $1 per point per 1.0 lot for SPX500, matching US30 and NAS100. CME E-mini S&P 500 futures (ES) use a $50 multiplier per contract.
If you want broader market exposure and are comfortable with the higher point value, SPX500 is worth comparing. Use the SPX500 lot size calculator to see how the sizing works. You can also compare correlations using the QQQ/SPY correlation tool to see how the Nasdaq-100 (tracked by QQQ) and S&P 500 (tracked by SPY) move relative to each other.
US30 vs NAS100: which is better to trade?
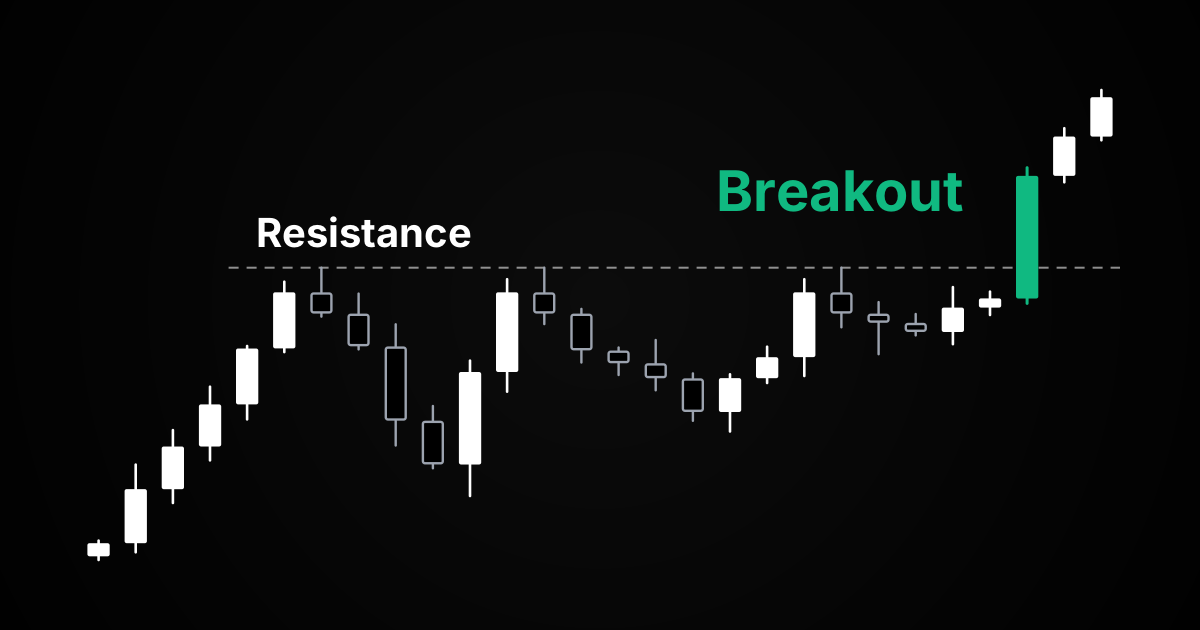
Neither index is better. They are different tools for different setups. If you are trading a breakout on a tech-driven day and want the instrument that moves fastest, NAS100 is usually the answer. If you are trading a range-bound setup where you need tighter stops and smaller point values, US30 may fit better. If you want broad market exposure with diversified sector representation, SPX500 is the third option.
The best index to trade depends on the structure you see, the volatility you expect, and the position size your account allows. Run the calculations before you decide. A great setup on the wrong instrument is still a bad trade if the sizing does not fit your risk.
Use the lot size calculators to compare. Enter your account size, risk percentage, entry, and stop into the US30, NAS100, and SPX500 calculators, then compare the resulting lot sizes. The one that lets you take a realistic position without overriding your risk rule is the one you should trade.
Trading hours and typical spreads
CME index futures trade nearly 24 hours a day, from Sunday evening to Friday afternoon U.S. time, with a brief maintenance break each day. CFD brokers typically follow similar hours, though exact availability depends on the broker. The most liquid hours are during the U.S. cash equity session, roughly 9:30 AM to 4:00 PM Eastern Time, when spreads are tightest and depth is best.
Spreads widen outside those hours. Asian and European session trading is possible, but the bid-ask spread can double or triple depending on the broker and the time. If you are trading a tight stop, wider spreads eat into your edge. Check the spread before you enter, especially if you are trading outside U.S. hours.
Typical spreads during liquid hours for retail CFD brokers are often 1 to 3 points on US30 and 1 to 4 points on NAS100, though this varies widely by broker. Futures spreads are usually tighter, often 1 point on US30 and 0.25 to 0.50 points on NAS100 during peak liquidity. Always confirm with your broker's live pricing.
Frequently Asked Questions
What is the difference between US30 and NAS100?
US30 tracks 30 large U.S. companies using price weighting, where higher-priced stocks have more influence. NAS100 tracks 100 non-financial Nasdaq companies using modified market cap weighting, where larger companies by market value carry more weight. US30 is broader across sectors; NAS100 is heavily concentrated in technology.
Which is better to trade, US30 or NAS100?
Neither is universally better. NAS100 typically has higher volatility and larger intraday ranges, making it suitable for breakout trades when tech is moving. US30 has narrower ranges and lower point values, making it easier to size for tighter stops. Choose based on the setup, your stop distance, and the point value that fits your risk.
How much is 1 pip in Nasdaq?
Point values vary by broker and contract type. CME E-mini Nasdaq-100 futures (NQ) are valued at $20 per index point per contract. Many CFD brokers use $1 per point per 1.0 lot, which is the convention SIWAI calculators use. Always verify your broker contract specifications before trading.
How do I calculate lot size for US30?
Divide your maximum risk in dollars by the risk per lot. Risk per lot equals your stop distance in points multiplied by the point value. Using the SIWAI calculator convention of $1 per point: with a $200 max risk and 100-point stop, risk per lot is $100, so lot size is $200 divided by $100, which equals 2.0 lots. Use the US30 lot size calculator to automate this.
How do I calculate lot size for NAS100?
Use the same method as US30. With the SIWAI calculator convention of $1 per point per 1.0 lot: a $200 max risk and 100-point stop gives a risk per lot of $100, so lot size is $200 divided by $100, which equals 2.0 lots. The NAS100 lot size calculator runs this for you. If your broker uses different contract sizes, adjust accordingly.
Can I trade US30 and NAS100 at the same time?
Yes, but size each position independently based on its stop distance and your broker point value. If your broker uses the same point value for both indices, the lot size calculation will be identical for equal stop distances. If your broker uses different contract sizes for each, account for that difference when sizing.
Risk Disclaimer: Trading stocks, options, futures, forex, and cryptocurrencies involves substantial risk of loss and is not suitable for every investor. Past performance does not guarantee future results. This article is for educational purposes only and does not constitute financial advice. You should carefully consider your financial situation and risk tolerance before trading. Never trade with money you cannot afford to lose.