inverted hammer
Inverted Hammer vs Shooting Star vs Hammer vs Hanging Man: One Shape, Four Meanings
An inverted hammer and a shooting star look almost identical: a small body near the low of the candle and a long upper wick. So do a hammer and a hanging man, which share a small body near the high and a long lower wick. Traders mix these four candles up constantly because the pictures match. The meaning does not. Location in the trend decides whether the candle is a bullish reversal hint or a bearish warning.
This comparison sorts inverted hammer vs shooting star, then hammer vs hanging man, with clear rules for confirmation, stops, and targets. You will see how to size the trade after the signal, and how a scanner helps you review candidates without staring at every chart by hand.
One shape, four meanings: why trend location is the whole game
Japanese candlestick charts encode open, high, low, and close in a single bar. A long wick shows rejection of a price extreme during that period. A small body shows the open and close finished close together. Those geometric facts are shared across the hammer family. What changes is the prior trend, which is why education sites such as Wikipedia's candlestick pattern overview and the Corporate Finance Institute candlestick guide stress context before colour.
Use this quick map. Long lower wick after a downtrend: hammer (bullish). Same shape after an uptrend: hanging man (bearish). Long upper wick after a downtrend: inverted hammer (bullish). Same shape after an uptrend: shooting star (bearish). If you ignore the trend and trade the picture alone, you will take the wrong side more often than not.
| Pattern | Shape | Where it forms | Bias |
|---|---|---|---|
| Hammer | Small body, long lower wick | After a downtrend | Bullish reversal |
| Hanging man | Same as hammer | After an uptrend | Bearish reversal |
| Inverted hammer | Small body, long upper wick | After a downtrend | Bullish reversal |
| Shooting star | Same as inverted hammer | After an uptrend | Bearish reversal |
Inverted hammer vs shooting star: same wick, opposite story
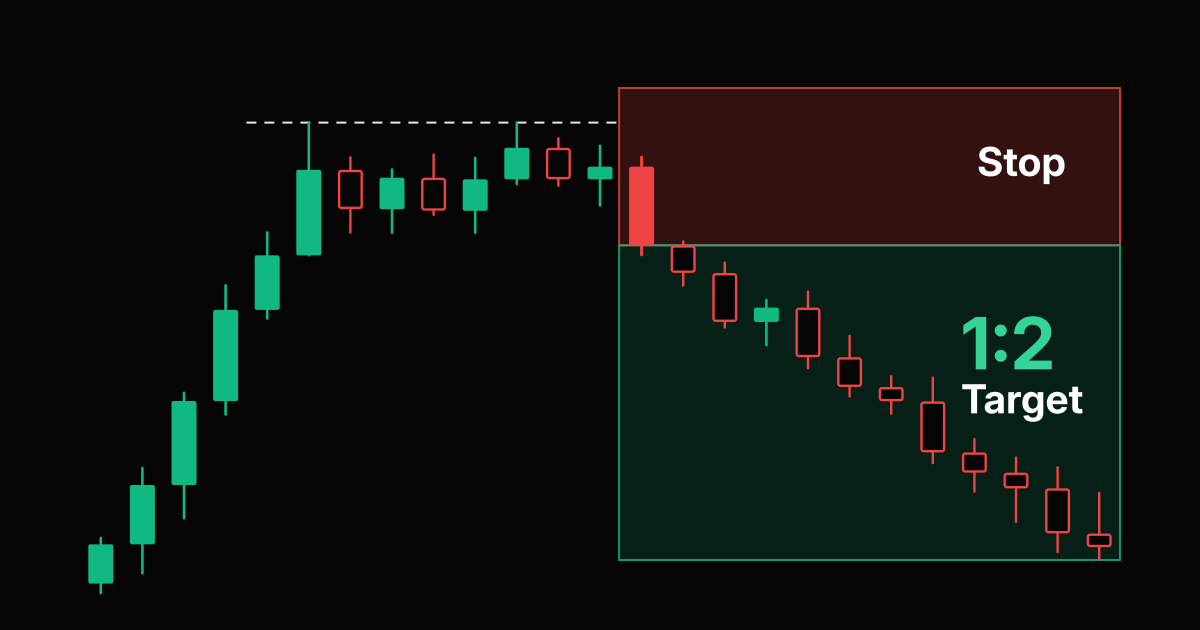
Both candles print a small real body near the session low and an upper wick at least about twice the body length, with little or no lower wick. Buyers pushed price higher during the period, then sellers pushed it back toward the open. That fight leaves a long upper shadow either way.
After a clear downtrend, that fight is an inverted hammer. Sellers had control into the candle. The failed probe higher shows demand appearing. Many traders treat it as a weaker bullish hint than a classic hammer, because the close stays near the lows. After a clear uptrend, the same shape is a shooting star. Buyers had control into the candle. The rejection of the high warns that supply is showing up near resistance.
Colour helps but does not rename the pattern. A green inverted hammer closed above its open and is usually a touch stronger than a red one. A red shooting star closed below its open and is usually a touch cleaner as a bearish warning. Never flip the label based on colour alone. Trend location still rules.
Hammer vs hanging man: the other twin pair
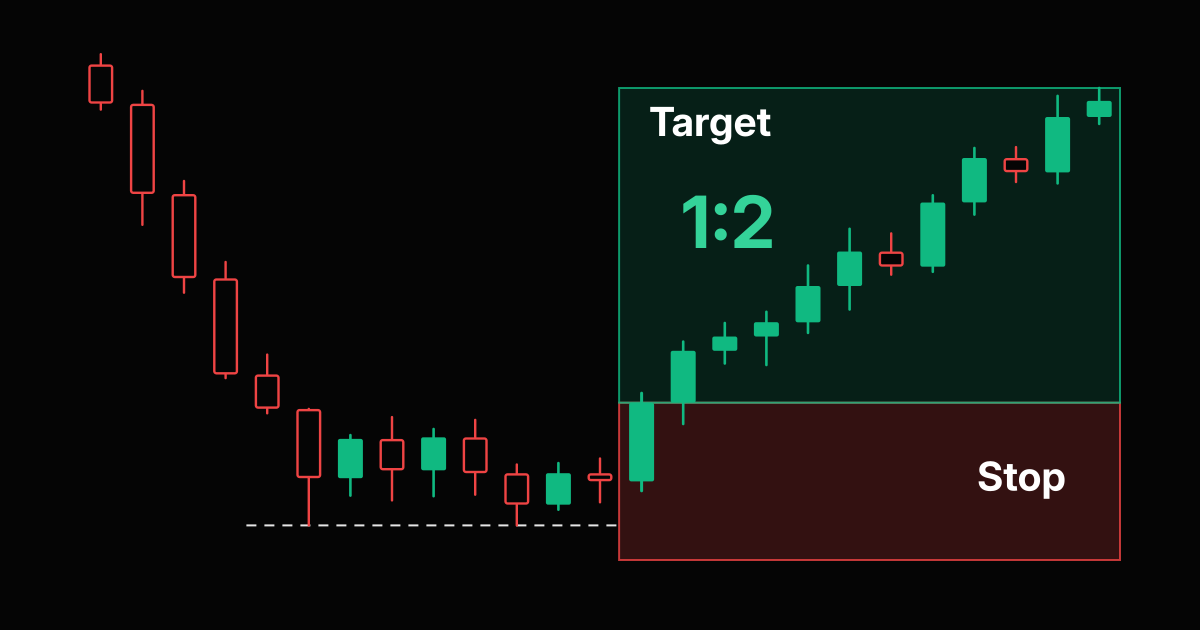
The hammer and hanging man share a small body near the high and a long lower wick, again roughly twice the body or more, with little upper wick. Sellers drove price down, then buyers recovered most of the move by the close. After a downtrend that recovery is a hammer and leans bullish. After an uptrend it is a hanging man and leans bearish, because the deep selloff during the period shows weakness under the highs.
Traders often call every long lower wick a hammer. That habit causes shorts to be missed and longs to be taken into late uptrends. Name the candle only after you mark the prior trend and the nearest support or resistance. If there is no clear trend, treat the bar as noise, not a signal.
Confirmation, invalidation, and when to skip the candle
A single candle is a claim. The next candle is evidence. For bullish hammers and inverted hammers, many playbooks wait for a close above the signal candle high before entering long. For bearish hanging man and shooting star setups, wait for a close below the signal candle low (or below the body for a stricter shooting star rule). Confirmation costs a few points of entry. It removes many one-bar fakeouts.
Invalidation sits on the opposite extreme of the pattern. Longs after a hammer or inverted hammer usually place the stop below the long wick. Shorts after a hanging man or shooting star place the stop above the long wick. If price reclaims that extreme, the rejection story failed.
- Skip mid-range candles. Without a prior trend or a clear level, the same shape is just a pause.
- Skip tiny wicks. If the wick is not clearly longer than the body, you do not have the pattern.
- Skip into major news if you cannot widen the stop. Event days can print perfect looking wicks that reverse in seconds.
Risk, reward, and lot size after the signal
Pattern recognition without position sizing is incomplete. Measure stop distance from entry to the invalidation wick, pick a risk percent of equity, then solve for lot size. On SIWAI index CFDs, US30, NAS100, and SPX500 use $1 per point per 1.0 lot. Forex and gold use the pair specific pip or point values in the calculators. Never invent a pip value.
Prefer setups where the first target is at least about twice the stop (a 1:2 reward to risk), as in the charts above. Recalculate size when the stop changes. Walk through the math in How to Calculate Risk Reward Ratio Before Entering a Trade and How to Calculate Lot Size in Forex, then plug live numbers into the risk reward calculator and the position size calculator.
Index traders can compare instruments the same way as in US30 vs NAS100, using US30, NAS100, and SPX500 lot calculators so the stop fits the account.
How to review these candles with a scanner
The hard part is not drawing the wick. It is catching the candle on the right instrument at the right time. A chart pattern scanner such as SIWAI surfaces candidate structures across stocks and crypto so you can check prior trend, nearby levels, and risk distance without hunting every ticker by hand. That workflow is the same idea as scanning stocks for chart patterns and the structure review in Head and Shoulders Pattern: Bullish or Bearish?.
Your checklist for each candidate: mark the prior swing, confirm the wick length vs the body, wait for the confirmation close, measure stop to the wick extreme, then size the trade. Event weeks, like the setups in Chart Patterns to Watch as October 2026 Opens, still use the same candle rules. News can be the catalyst. It does not rewrite the definitions.
Frequently asked questions
What is the difference between an inverted hammer and a shooting star?
They share the same shape: a small body near the low and a long upper wick. An inverted hammer forms after a downtrend and is a bullish reversal hint. A shooting star forms after an uptrend and is a bearish reversal warning. Trend location is the difference.
What is the difference between a hammer and a hanging man?
They share a small body near the high and a long lower wick. A hammer forms after a downtrend and leans bullish. A hanging man forms after an uptrend and leans bearish. Naming the candle without the prior trend is the most common mistake.
Do I need confirmation before trading these candles?
Yes for most playbooks. Wait for the next candle to close beyond the signal extreme in the trade direction: above the high for bullish hammers and inverted hammers, below the low for hanging man and shooting star setups. Confirmation reduces one-bar fakeouts.
Where should the stop loss go?
Place the stop on the invalidation side of the wick. For longs after a hammer or inverted hammer, below the low of the signal candle. For shorts after a hanging man or shooting star, above the high of the signal candle. Widen the stop only if you reduce size so dollar risk stays fixed.
Is candle colour more important than trend location?
No. Colour can strengthen or soften the read, but it does not rename the pattern. A red inverted hammer after a downtrend is still an inverted hammer. A green shooting star after an uptrend is still a shooting star.
How do I size a trade after a candlestick reversal signal?
Measure stop distance from entry to the invalidation wick, choose a risk percent of equity, then calculate lot size with the SIWAI position size or lots calculators. For US30, NAS100, and SPX500, SIWAI uses $1 per point per 1.0 lot.
Risk Disclaimer: Trading stocks, options, futures, forex, and cryptocurrencies involves substantial risk of loss and is not suitable for every investor. Past performance does not guarantee future results. This article is for educational purposes only and does not constitute financial advice. You should carefully consider your financial situation and risk tolerance before trading. Never trade with money you cannot afford to lose.