chart patterns
Chart Patterns to Watch as October 2026 Opens
October 2026 opens with a major data release on the calendar. The US jobs report for September lands Friday morning, October 2, at 8:30 AM ET, and markets will react. Traders who know which chart patterns to watch and how to position before the news have an edge.
This guide explains which technical setups matter around high volatility events, how big economic data moves indices like NAS100 and US30 plus assets like gold and bitcoin, and the checklist you need before the opening bell on release day.
Why the jobs report moves markets across asset classes
The Employment Situation report from the Bureau of Labor Statistics measures job creation, the unemployment rate, and wage growth. These numbers directly influence Federal Reserve policy, which in turn affects interest rates, the dollar, and asset valuations across stocks, commodities, and crypto.
When jobs data comes in stronger than expected, traders often interpret that as economic strength. The dollar may rally, yields may rise, and equity indices can move sharply depending on what the data means for Fed rate decisions. When the data disappoints, the opposite can happen. Gold and bitcoin sometimes react to dollar strength or weakness, while indices like NAS100 and US30 respond to shifts in growth expectations and rate outlooks.
The jobs report is scheduled for release at 8:30 AM ET on Friday, October 2, 2026. That timing means premarket volatility for US equity futures and immediate reactions in forex and crypto pairs. Traders watching chart patterns need to know which setups are already in place before the data hits, and which structures are likely to break or hold based on the reaction.
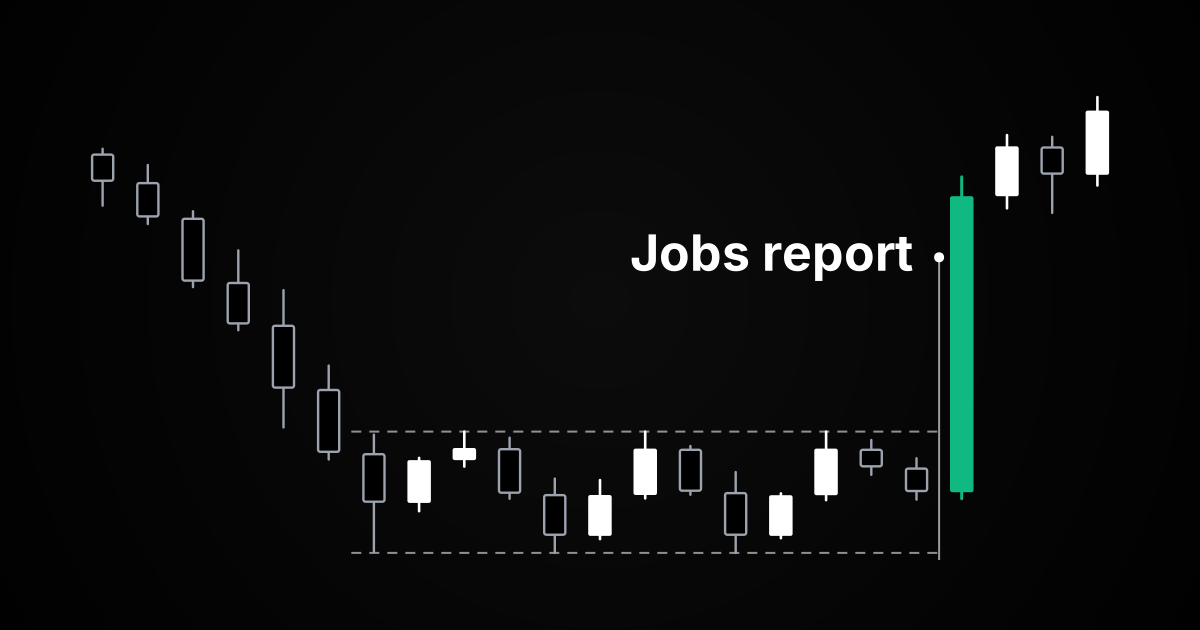
Chart patterns that matter around big data releases
Not every pattern holds its shape through a volatile news event. The setups that work best are the ones with defined support and resistance, clear invalidation levels, and enough room between entry and stop to survive normal noise. These are the structures traders watch heading into release day.
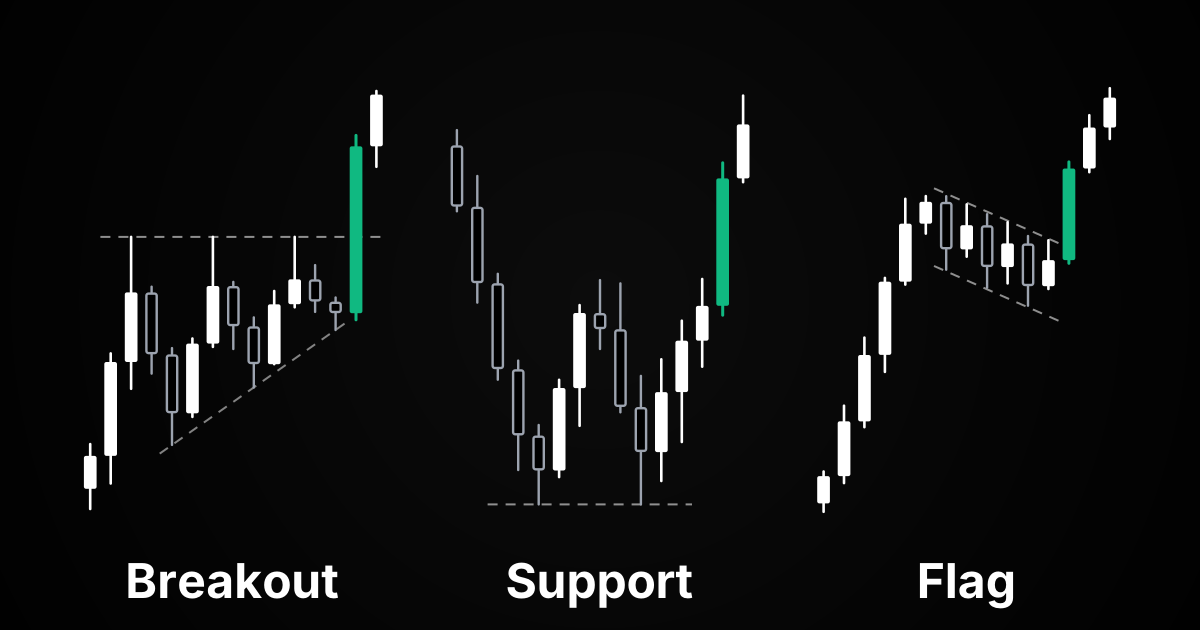
Breakout setups from ranges or triangles
When price has been consolidating inside a range, triangle, or rectangle for days or weeks, a data release can provide the catalyst for a breakout. The pattern is already formed. The news supplies the volume and direction. Traders who mark the highs and lows of the pattern before the release know exactly where the breakout level sits and where the stop belongs if the structure fails.
A breakout above resistance with strong volume on the release confirms the move. A fake breakout that reverses quickly tells you the pattern did not hold. Either way, the setup was defined before the data, not invented after the fact.
Flag and pennant continuation patterns
If an index or crypto pair has been trending into the jobs report, look for flags or pennants that formed during the pause. These are consolidation patterns within a larger trend. A bullish flag in US30 heading into the data means traders are watching for continuation if the news supports the trend, or a breakdown if sentiment shifts.
Flags work because they give you a high probability setup when the prior trend is strong and the consolidation is tight. The data release becomes the trigger, not the reason to enter. You already know the structure, the trend, and the risk before the number prints.
Support and resistance zones at key levels
Sometimes the best trade is not a pattern but a level. If NAS100 is sitting just above a major support level or bitcoin is testing a resistance zone that has held for weeks, the jobs report can decide whether that level breaks or holds. Traders position around these zones, not in the middle of nowhere.
The advantage of trading from support or resistance is that your stop is clear and your invalidation is defined. If the level breaks, you know the structure failed. If it holds, you know the setup confirmed. News events amplify the decision but do not change the logic.
Candlestick signals that confirm the pattern
Chart patterns tell you where the structure sits. Candlestick signals tell you whether momentum is confirming or failing. Around a data release, the first few candles after the print matter. You want to see follow through, not just a spike and reversal.
Engulfing candles after the data hits
A bullish engulfing candle on the 15-minute or 1-hour chart after the jobs report can confirm a breakout from resistance. The prior candle shows hesitation or rejection. The engulfing candle opens lower and closes above the prior high with strong volume. That is confirmation the buyers are in control.
Bearish engulfing works the same way in reverse. If NAS100 or US30 gaps up on the release but forms a bearish engulfing candle within the first hour, that is a signal the move lacks conviction. Traders who wait for the candlestick signal avoid chasing a move that reverses immediately.
Impulse bars that show directional strength
An impulse bar is a large candle with a small wick and strong close in the direction of the move. When you see an impulse bar on the reaction to the data, it tells you the market has conviction. A series of small indecisive candles after a release tells you the market is not sure what to do yet.
Impulse candles give you permission to enter. Weak candles after the data tell you to wait. The pattern on the higher timeframe might look perfect, but if the intraday candles show no follow through, the trade is not ready.
Gaps and how they get filled or extended
Jobs reports sometimes cause gaps in equity futures. A gap up at the open can either fill quickly if the move was overdone, or extend if the momentum is real. The way the gap behaves in the first 30 to 60 minutes tells you what kind of day it will be.
If the gap fills fast, that is often a reversal setup. If the gap holds and price consolidates near the new level, that can become the launching point for continuation. Gaps are not a pattern by themselves but they change where support and resistance sit for the rest of the session.
Managing risk and position size around volatility events
Chart patterns and candlestick signals tell you where to look. Risk management tells you whether the trade makes sense given how much the market might move. A jobs report can create two or three times normal volatility in the first 30 minutes. If your stop is too tight for that environment, you will get stopped out on noise before the real move develops.
Widen stops to account for volatility
On a normal day, a 20-point stop on NAS100 might be reasonable. On jobs report day, that same 20 points can get hit in the first minute even if the trend is in your favor. Traders who account for event volatility widen their stops or reduce their position size so the dollar risk stays the same.
Use a position size calculator to figure out how many shares or contracts to take when your stop is wider. If your normal stop is 20 points and you increase it to 40 points for the event, you cut your position size in half to keep the same dollar risk. That is how you stay in the trade through the noise without increasing your exposure.
Calculate risk reward before you commit
High volatility increases both risk and reward potential. The target that seemed far away on a quiet day might be reachable within an hour after the jobs data. But that does not mean every setup qualifies. You still need to calculate risk reward ratio before entry.
If your risk reward is 1:2 or better and the pattern supports the trade, proceed. If widening the stop to handle volatility drops your ratio below 1:2, the setup might not be worth it. A good pattern with bad risk reward is still a bad trade.
Avoid trading right at the release time
Some traders wait for the first candle to close after the data before entering. That gives you a chance to see whether the reaction has follow through or if it was just a spike. The first 60 seconds after 8:30 AM can be chaotic. Spreads widen, slippage increases, and prices whip in both directions.
If the pattern and candlestick setup are still valid 5 or 10 minutes after the release, the trade is probably cleaner. You lose a few points of profit but you avoid the worst of the chaos. Most profitable moves last longer than 60 seconds. Waiting for clarity is not the same as missing the trade.
What October and Q4 mean for technical setups
October marks the start of the fourth quarter, and market structure tends to shift as the year moves toward a close. Trends that were established in the summer either confirm or reverse. Volatility often picks up as institutional money repositions for year end. For traders watching chart patterns, the key is to follow what the structure shows, not what the calendar suggests.
In crypto markets, some traders watch Q4 for seasonal patterns, but past behavior does not predict future moves. What matters is the structure on the chart. Bitcoin and altcoin correlations can shift based on macro conditions, regulatory developments, and broader risk sentiment, which affects how patterns develop. You can track that with a crypto correlation tool to see whether BTC and ETH are moving together or diverging as Q4 unfolds.
Equity indices like NAS100 and US30 also respond to Q4 dynamics. Earnings season, Fed meetings, and geopolitical developments layer on top of technical structure. A clean breakout in early October can set the tone for the rest of the quarter, or fail and lead to a range. Either way, the chart tells you what is happening. Your job is to follow the structure, not predict what should happen based on the time of year.
The jobs report on October 2 is one data point. The patterns that form around it are what matter for your trades. If the setup is valid and the risk reward makes sense, the trade works regardless of whether it is October or any other month.
Pre release checklist for trading around the jobs report
The best traders do not improvise on release day. They prepare the day before and execute the plan they already built. Here is what to review before the market opens on Friday, October 2.
- Mark key levels and patterns on your charts. Identify support, resistance, consolidation ranges, and any breakout or breakdown levels that could trigger on the news. If the pattern is not clear the day before, it probably will not be clear in the moment.
- Calculate position size for wider stops. If you normally use a 20-point stop, plan for 30 or 40 points on event day. Use a lots calculator to figure out how many contracts or shares keep your dollar risk the same.
- Review the expected range of outcomes. Check what economists are forecasting for jobs added, unemployment rate, and wage growth. You do not need to trade based on the forecast, but knowing the consensus helps you gauge whether the reaction is typical or extreme.
- Decide whether you will trade the initial spike or wait. Some traders take positions before the release and manage through the volatility. Others wait 10 or 15 minutes for the dust to settle. Both approaches work. Pick one and stick to it.
- Set alerts for breakout levels. If you are not watching the screen at 8:30 AM, set alerts so you know when price hits your predetermined levels. Do not chase moves you missed. Wait for the next setup.
- Check for other scheduled news or events. Sometimes multiple data points or Fed speakers are scheduled the same day. Know what else might move the market beyond the jobs report.
If you complete this checklist the night before, release day is execution, not guesswork. The chart patterns are already marked. The stops and targets are already set. The position size is already calculated. You just follow the structure.
Scanning for patterns across multiple assets before the release
Manually reviewing charts for every index, forex pair, commodity, and crypto before a jobs report is not realistic. That is where a chart pattern scanner becomes useful. Instead of checking 50 charts by hand, you scan the market for breakouts, flags, triangles, and candlestick setups that are already forming.
SIWAI scans 1,000+ stocks and cryptos daily for chart patterns and candlestick setups. You get a filtered feed of setups that are already in place, with stops and targets marked. On the day before a major data release, you can review the scan results and pick the setups that fit your strategy, then wait to see how the market reacts to the news.
A scanner does not tell you what to trade. It shows you what is already structured. You still confirm the pattern, check the risk reward, size the position, and decide whether the trade fits your plan. The scanner just removes the 2-hour chart hunt so you can focus on execution.
If you prefer to scan stocks for chart patterns manually, that works too. The principle is the same. Find the setups before the news, not after.
Frequently Asked Questions
What chart patterns work best around the jobs report?
Breakouts from ranges or triangles, flag or pennant continuations, and trades from major support or resistance zones. These patterns have defined stops and clear invalidation levels, which matter when volatility spikes after the Employment Situation release.
Should I trade right when the jobs report is released?
Most traders wait 5 to 15 minutes after the 8:30 AM ET release for spreads to tighten and the initial chaos to settle. If the pattern and candlestick setup are still valid after the first reaction, the trade is usually cleaner than trying to catch the spike.
How does the jobs report affect bitcoin and crypto?
Jobs data influences Federal Reserve rate expectations, which affects the dollar and risk sentiment. Bitcoin and crypto markets often react to dollar strength or weakness, plus broader shifts in risk appetite that follow strong or weak employment prints.
What timeframe should I use to watch chart patterns during the jobs report?
Most traders use daily or 4-hour charts to identify the pattern structure before the release, then switch to 15-minute or 1-hour charts to watch the reaction and confirm the breakout or breakdown with candlestick signals.
How do I calculate position size for higher volatility around the jobs report?
Widen your stop to account for event volatility, then reduce your position size so your dollar risk stays the same. If your normal stop is 20 points and you widen it to 40 points, cut your position size in half. Use a position size calculator to get the exact number of shares or contracts.
Can I scan for chart patterns before the jobs report?
Yes. A chart pattern scanner like SIWAI shows you which setups are already formed across stocks, indices, and crypto before the data hits. You review the patterns the day before, mark your levels, and wait to see how the market reacts. The scanner saves time compared to checking charts manually.
Risk Disclaimer: Trading stocks, options, futures, forex, and cryptocurrencies involves substantial risk of loss and is not suitable for every investor. Past performance does not guarantee future results. This article is for educational purposes only and does not constitute financial advice. You should carefully consider your financial situation and risk tolerance before trading. Never trade with money you cannot afford to lose.