head and shoulders
Head and Shoulders Pattern: Bullish or Bearish? Rules, Targets and Real Scanner Examples
Traders ask the same question every time a three peak shape shows up on the chart: is the head and shoulders pattern bullish or bearish? The short answer depends on which version you are looking at. A classic head and shoulders top is a bearish reversal after an uptrend. An inverse head and shoulders is a bullish reversal after a downtrend. Both use the same structure, flipped.
This guide covers the rules that define each version, how to measure a target from the neckline, where to place the stop, and how a pattern scanner helps you find completed setups instead of hunting charts by hand.
Is the head and shoulders pattern bullish or bearish?
The classic head and shoulders is bearish. It forms after a sustained advance: left shoulder, higher head, lower right shoulder, then a break below the neckline. That break confirms sellers have taken control and the prior uptrend is reversing. Educational sources such as Corporate Finance Institute and Wikipedia describe it as a reversal pattern that signals a shift from bullish to bearish conditions once the neckline fails.
The inverse head and shoulders is bullish. It forms after a decline: left shoulder low, deeper head, higher right shoulder, then a break above the neckline. That break confirms buyers have absorbed the selling and the prior downtrend is reversing. Same skeleton, opposite direction. If you only remember one rule, remember this: the classic pattern is a top (bearish), the inverse pattern is a bottom (bullish).
A shape that looks similar but sits in the middle of a range is not yet a trade. Context matters. The pattern needs a clear prior trend to reverse. Without that trend, three peaks or three troughs are often just noise.
Classic head and shoulders rules (bearish top)
A valid classic head and shoulders has four parts. Skip any one of them and you are guessing, not trading a defined setup.
- Prior uptrend. Price has been making higher highs and higher lows before the left shoulder. The pattern is a reversal, so there must be something to reverse.
- Left shoulder. A peak, then a pullback that marks the first reaction low. That low becomes one end of the neckline.
- Head. A higher peak than the left shoulder, then a pullback that returns near the first reaction low. The head is the highest point of the pattern.
- Right shoulder and neckline break. A third peak that fails to take out the head, then a decline that breaks the neckline connecting the two reaction lows. Confirmation is the close below that line, not a brief wick.
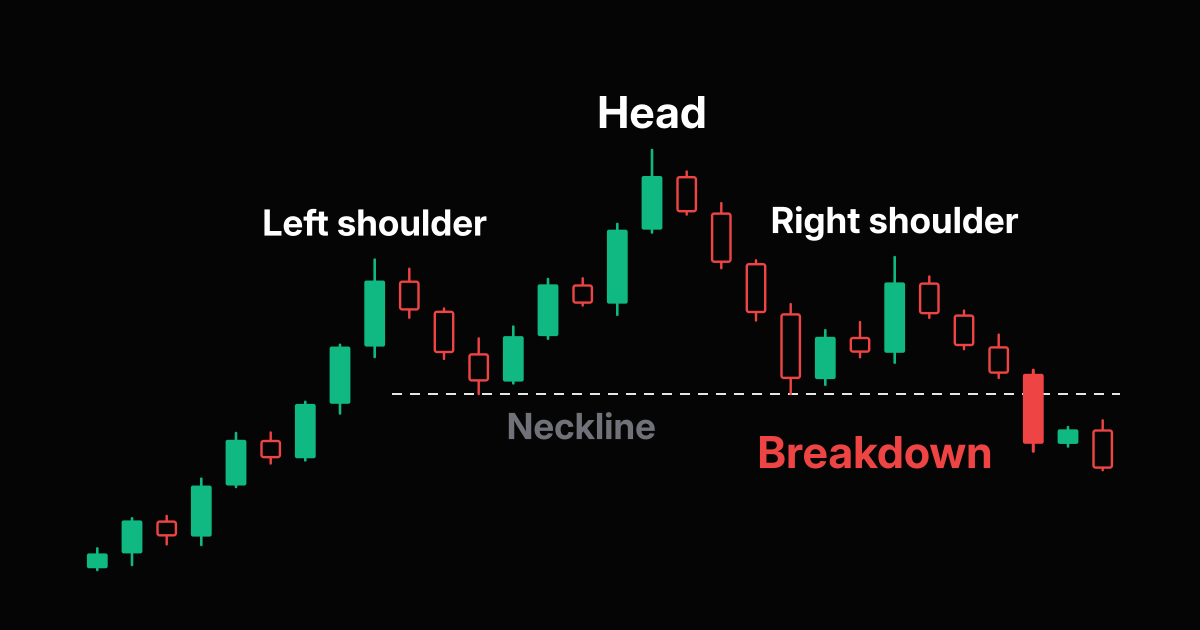
Volume often rises into the left shoulder and head, then fades on the right shoulder. A surge on the neckline break adds confidence, but volume patterns vary by market. Index CFDs and forex do not always print clean volume the way stocks do, so treat volume as a filter, not a hard rule.
Charles Schwab's education desk walks through the same peak, head, and neckline sequence in Identifying Head and Shoulders Patterns in Stock Charts. The structure is the same whether you trade equities, indices, or crypto pairs.
Inverse head and shoulders rules (bullish bottom)
Flip the classic pattern. After a downtrend, price prints a left shoulder low, a deeper head, and a right shoulder that holds above the head. The neckline connects the reaction highs between those troughs. Confirmation is a close above the neckline.
Entry is typically on the neckline break or on a retest of the broken neckline as support. Stop sits below the right shoulder (or below the head for a wider stop and smaller size). Target uses the same measured move math as the classic pattern, projected upward from the breakout.
Because the inverse pattern is the bullish twin, scanners that flag "head and shoulders" should also distinguish tops from bottoms. Mixing them up reverses your bias and puts your stop on the wrong side of the structure.
Neckline, measured target, and stop placement
The neckline is the decision line. Draw it across the two reaction lows (classic top) or the two reaction highs (inverse bottom). It can be flat or slightly sloping. Steep necklines are less reliable because the break often happens with less follow through.
The textbook target is a measured move: take the vertical distance from the head to the neckline, then project that distance from the breakout point in the direction of the break. For a classic top, subtract the height from the neckline break. For an inverse bottom, add the height above the neckline break. That target is an estimate, not a promise. Price can overshoot or stall early.
Stop placement belongs on the invalidation side of the pattern. On a classic top short, the stop sits above the right shoulder (tighter) or above the head (wider). On an inverse long, the stop sits below the right shoulder or below the head. Wider stops need smaller position size so dollar risk stays constant. Pair the stop and target with a risk reward calculator before you enter, the same workflow covered in How to Calculate Risk Reward Ratio Before Entering a Trade.
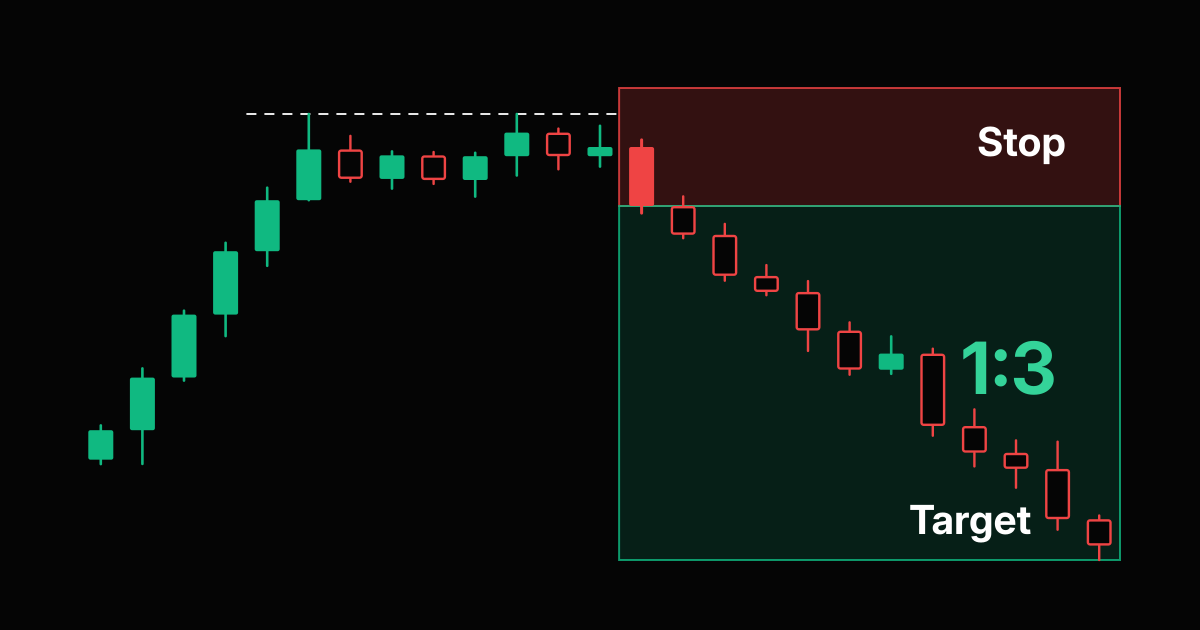
When the measured move is only about as far as the stop, the ratio is near 1:1. That can still be tradable if your win rate and costs support it, but many discretionary traders skip low ratio breaks and wait for a clearer projection or a tighter stop on a clean right shoulder.
How a scanner surfaces real head and shoulders setups
Spotting one clean head and shoulders by hand is easy. Scanning hundreds of stocks, indices, and crypto pairs every morning is not. A chart pattern scanner flags candidates that already show left shoulder, head, and right shoulder structure so you review confirmation levels instead of drawing every chart from scratch. That is the same idea behind How to Scan Stocks for Chart Patterns Without Hours of Chart Hunting.
In practice, a useful scan checklist looks like this:
- Is there a clear prior trend (up for classic, down for inverse)?
- Is the head clearly higher (classic) or lower (inverse) than both shoulders?
- Are the shoulders roughly similar in height, without requiring perfection?
- Where is the neckline, and has price closed through it yet?
- Does the measured target clear nearby structure, or is it blocked by a major level?
- What stop and lot size keep risk at your chosen percent of equity?
SIWAI's daily feed is built for that review loop: patterns are detected across the watchlist, you open the chart, mark neckline and measured move, then size the trade with the position size calculator or a pair specific lots calculator. For index CFDs, remember US30, NAS100, and SPX500 use $1 per point per 1.0 lot when you convert stop distance into risk dollars.
Seasonal or event driven weeks, such as the setups discussed in Chart Patterns to Watch as October 2026 Opens, still use the same head and shoulders rules. The news may provide the catalyst for the neckline break; the pattern rules do not change.
Common mistakes that invalidate the pattern
- Trading before the neckline break. Three peaks alone are not confirmation. Early shorts into a still rising market get stopped when the right shoulder extends.
- Ignoring the prior trend. A head and shoulders drawn inside a sideways range is usually a coincidence, not a reversal.
- Forcing symmetry. Shoulders do not need to be identical. Roughly similar height and duration is enough. Perfect mirrors are rare.
- Mixing classic and inverse bias. Shorting an inverse pattern or buying a classic top puts you against the structure you just identified.
- Skipping risk math. A perfect looking neckline with a tiny measured move and a huge stop is a poor trade. Size from risk first, as in the forex lot size guide and the US30 vs NAS100 sizing comparison.
Frequently asked questions
Is the head and shoulders pattern bullish or bearish?
The classic head and shoulders top is bearish. It forms after an uptrend and confirms when price breaks below the neckline. The inverse head and shoulders is bullish. It forms after a downtrend and confirms when price breaks above the neckline.
What is the neckline in a head and shoulders pattern?
The neckline connects the two reaction lows under a classic top, or the two reaction highs above an inverse bottom. A close through that line confirms the pattern. Brief wicks that do not close beyond the neckline are usually not enough.
How do you calculate the head and shoulders price target?
Measure the vertical distance from the head to the neckline, then project that distance from the breakout point in the direction of the break. Subtract for a classic top. Add for an inverse bottom. The target is an estimate, not a guarantee.
Where should the stop loss go on a head and shoulders trade?
Place the stop on the invalidation side of the structure. For a classic top short, above the right shoulder or above the head. For an inverse long, below the right shoulder or below the head. Widen the stop only if you reduce position size so dollar risk stays the same.
What is the difference between head and shoulders and inverse head and shoulders?
Classic head and shoulders has three peaks with the middle peak highest and breaks down through support. Inverse head and shoulders has three troughs with the middle trough deepest and breaks up through resistance. One is a top reversal. The other is a bottom reversal.
Can a chart pattern scanner find head and shoulders setups?
Yes. A scanner like SIWAI flags candidate structures across stocks and crypto so you can review prior trend, neckline, and measured move without checking every chart by hand. You still confirm the break and size the trade yourself.
Risk Disclaimer: Trading stocks, options, futures, forex, and cryptocurrencies involves substantial risk of loss and is not suitable for every investor. Past performance does not guarantee future results. This article is for educational purposes only and does not constitute financial advice. You should carefully consider your financial situation and risk tolerance before trading. Never trade with money you cannot afford to lose.