EURJPY
EURJPY vs GBPJPY: Correlation, Volatility and How to Size Both in 2026
EURJPY and GBPJPY are two of the most closely linked pairs in forex. On ECB reference rates to October 30, 2026, their daily returns had a 0.95 correlation over three months and 0.89 over one year. They closed in the same direction on 53 of the last 66 fixing days (80%).
That does not make them the same trade every month. In October, EURJPY fell 1.53% while GBPJPY rose 1.23%, because the euro lost ground against the pound. This comparison covers why the two crosses move together, when they split, which one moves more in pips, and how to size both from one risk budget. You can check the live reading on the free EURJPY vs GBPJPY correlation page.
What moves EURJPY and GBPJPY
EURJPY is the price of one euro in Japanese yen, and GBPJPY is the price of one British pound in yen. Both share the same quote currency, so anything that moves the yen on its own moves both crosses at once. Bank of Japan decisions (see the BoJ monetary policy releases) and broad risk appetite are the usual yen drivers, and that shared leg is what the correlation coefficient picks up.
The other leg is where they differ. EURJPY also carries the euro, set by the ECB key interest rates, and GBPJPY carries the pound, set by the Bank of England Bank Rate. The gap between the two is simply EURGBP: EURJPY divided by GBPJPY equals EURGBP. When EURGBP is flat, the two crosses move almost one for one. When EURGBP trends, they drift apart.
A coefficient of +1 means two pairs always move together, 0 means no linear link and -1 means they always move in opposite directions. A reading of 0.95 is about as high as two different currency pairs get.
EURJPY vs GBPJPY correlation by time frame
The inputs are ECB euro reference rates (see the ECB reference rates page) loaded through the Frankfurter exchange rate API, converted to yen crosses and compared as daily percentage returns. All windows end on October 30, 2026.
| Window | Correlation | Same direction days | Share |
|---|---|---|---|
| 1 month | 0.85 | 17 of 23 | 74% |
| 3 months | 0.95 | 53 of 66 | 80% |
| 6 months | 0.92 | 104 of 130 | 80% |
| 1 year | 0.89 | 208 of 256 | 81% |
| 2 years | 0.86 | 418 of 512 | 82% |
The one month reading dropped to 0.85 because of October's split. The longer windows tell the real story: these two crosses spend most of their time moving together.
How both compare with the other yen pairs
Both crosses are also tied to USDJPY and the other yen crosses, and that is worth knowing before you hold several of them. The euro and the pound legs show up in the EURGBP row: EURJPY barely reacts to EURGBP, while GBPJPY tends to fall when EURGBP rises (because a rising EURGBP means a weaker pound).
| Pair | EURJPY 3M | EURJPY 1Y | GBPJPY 3M | GBPJPY 1Y |
|---|---|---|---|---|
| USDJPY | 0.87 | 0.72 | 0.87 | 0.68 |
| CADJPY | 0.87 | 0.80 | 0.87 | 0.78 |
| AUDJPY | 0.83 | 0.79 | 0.85 | 0.82 |
| CHFJPY | 0.81 | 0.83 | 0.82 | 0.76 |
| NZDJPY | 0.79 | 0.76 | 0.82 | 0.77 |
| EURGBP | 0.06 | 0.05 | -0.26 | -0.40 |
Over one month, both crosses were far less tied to USDJPY (0.48 for EURJPY and 0.54 for GBPJPY), which fits a month when the euro and the pound did most of the moving. For the dollar side of the yen, read our USDJPY correlation article.
EURJPY vs GBPJPY side by side
Because both pairs are quoted in yen, a pip is worth the same on each: 1.0 standard lot is 1,000 yen per pip, about $6.36 at the October 30 USDJPY rate of 157.25. What differs is how many pips each one moves.
| Measure | EURJPY | GBPJPY |
|---|---|---|
| Rate on Oct 30, 2026 | 175.68 | 210.70 |
| Average daily move, 3 months | 58.7 pips | 74.4 pips |
| Median daily move, 3 months | 36.3 pips | 46.9 pips |
| Average daily move, 1 year | 51.1 pips | 68.0 pips |
| Median daily move, 1 year | 35.6 pips | 50.2 pips |
| Daily volatility, 3 months | 0.51% | 0.53% |
| Daily volatility, 1 year | 0.41% | 0.45% |
| Pip value per 1.0 lot | about $6.36 | about $6.36 |
GBPJPY moves roughly 25% to 40% more pips a day, but most of that comes from its higher price, not from bigger percentage swings. In percentage terms the two are close: 0.51% against 0.53% a day over three months. The practical effect is that GBPJPY needs a wider stop in pips for the same setup, so the same lot size risks more money on it. Our USDJPY and GBPJPY lot size guide walks through that pip math in detail.
Why they split in October 2026
From September 29 to October 30, 2026, EURJPY fell from 178.41 to 175.68 (-1.53%) while GBPJPY rose from 208.14 to 210.70 (+1.23%). Over the same days EURGBP dropped from 0.857 to 0.834, and USDJPY was almost flat at 157.12 to 157.25. The yen leg did nothing; the whole gap came from the euro weakening against the pound.
| Change | 1 month | 3 months | 1 year |
|---|---|---|---|
| EURJPY | -1.53% | -6.05% | -0.78% |
| GBPJPY | +1.23% | -3.42% | +4.80% |
| USDJPY | +0.08% | -3.49% | +3.34% |
| EURGBP | -2.73% | -2.73% | -5.32% |
The one year column shows the same pattern on a bigger scale: EURGBP fell from 0.881 to 0.834, so GBPJPY gained 4.80% while EURJPY ended slightly lower. When the two crosses disagree, look at EURGBP first. That tells you whether you are trading the yen or a euro and pound story.
How much risk you stack trading both
Two positions that each risk 1% swing together like one bigger position when they are correlated. The combined swing is the square root of (2 + 2 times the correlation), in units of one position's risk.
| Positions | Correlation used | Behaves like |
|---|---|---|
| Long EURJPY and long GBPJPY | 0.95 (3 months) | about 1.97% of risk |
| Long EURJPY and long GBPJPY | 0.89 (1 year) | about 1.94% of risk |
| Long EURJPY and long GBPJPY | 0.85 (1 month) | about 1.92% of risk |
| Long one, short the other | 0.95 (3 months) | about 0.32% of risk |
Buying both is close to doubling one trade. Long one and short the other leaves mostly the EURGBP move, which is a different trade entirely, so only do it if EURGBP is the idea. The guide to using correlation in forex covers the general rule.
Lot sizing EURJPY and GBPJPY
Lots = risk in dollars divided by (stop in pips times pip value). With the pip worth about $6.36 per lot on both crosses, only the stop changes. The table uses 1% risk, a 35 pip stop on EURJPY and a 45 pip stop on GBPJPY (close to each pair's three month median daily move), rounded down to 0.01 lot.
| Account | 1% risk | EURJPY, 35 pip stop | GBPJPY, 45 pip stop |
|---|---|---|---|
| $1,000 | $10 | 0.04 lot (about $9) | 0.03 lot (about $9) |
| $5,000 | $50 | 0.22 lot (about $49) | 0.17 lot (about $49) |
| $10,000 | $100 | 0.44 lot (about $98) | 0.34 lot (about $97) |
| $25,000 | $250 | 1.12 lots (about $249) | 0.87 lot (about $249) |
If you want both on a $10,000 account with 40 and 50 pip stops, full size on each would be 0.39 and 0.31 lot, about $99 of risk each and $198 together, almost 2% on one yen idea. Splitting one $100 budget gives 0.19 and 0.15 lot, about $48 each and $96 in total. Check your own numbers with the EURJPY lot size calculator, the GBPJPY lot size calculator or the position size calculator.
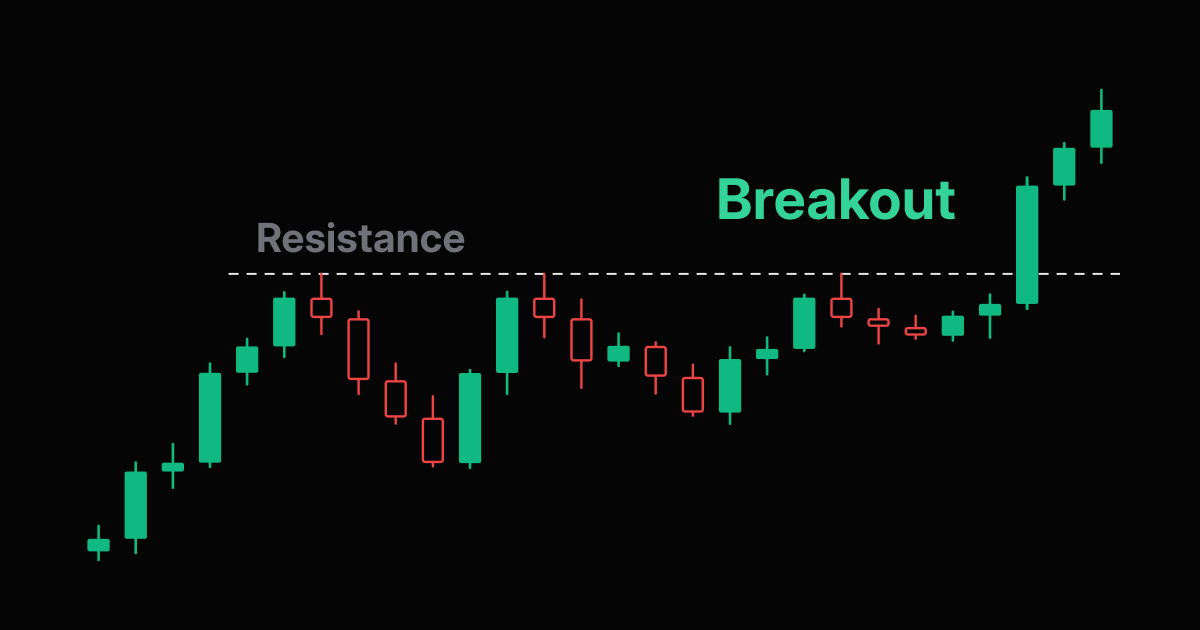
Reading a yen cross breakout
When one of the two crosses breaks out, the other one tells you what kind of move it is:
- Both breaking out with USDJPY: it is a yen move. You have one idea on three charts, so pick the cleanest one or split one risk budget.
- GBPJPY breaking out with EURJPY flat: it is a pound move, and EURGBP is probably falling. GBPUSD is the better place to confirm it.
- EURJPY breaking out with GBPJPY flat: it is a euro move, so check EURUSD and the ECB calendar.
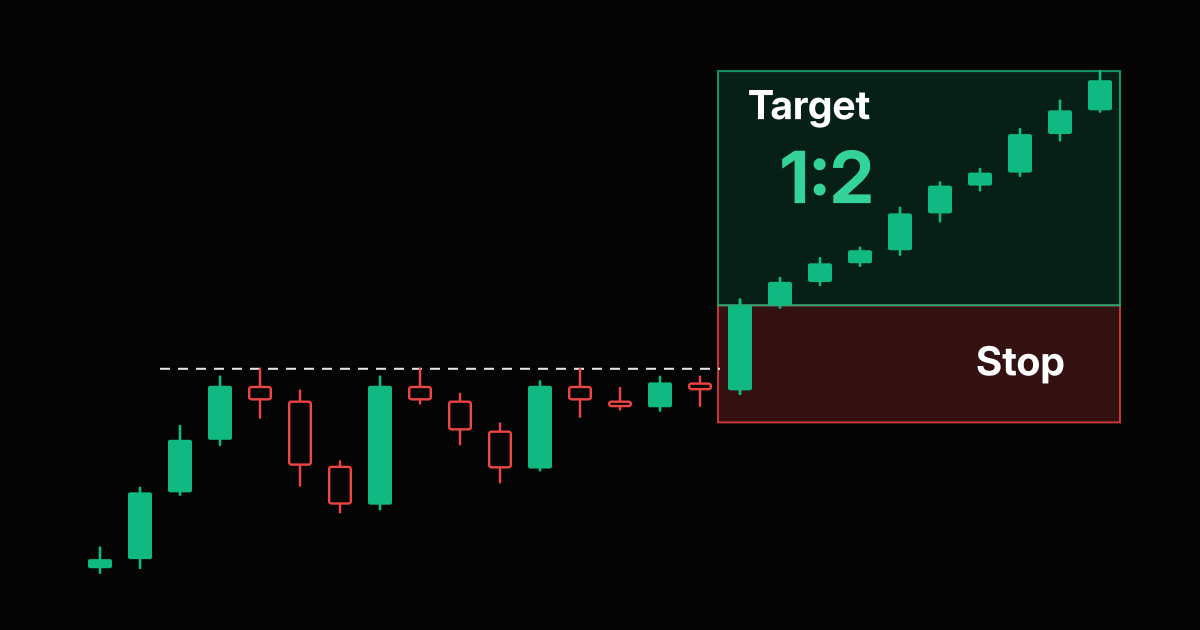
None of this makes a breakout more likely to work. It tells you what you are actually betting on. Check the payoff with the risk reward calculator before you size.
A five step check before trading both
- Open the EURJPY vs GBPJPY correlation page and read the 1M and 3M values, not only 1Y.
- Check EURGBP: a trending EURGBP means the two crosses can split.
- Check USDJPY: if it moves with both, the trade is about the yen.
- If both trades are the same yen idea, give them one risk budget and split it.
- Size each leg from its own stop, with about $6.36 per pip per 1.0 lot on both at 157.25.
Frequently Asked Questions
Are EURJPY and GBPJPY correlated?
Yes, strongly. On ECB reference rates to October 30, 2026, the correlation of daily returns was 0.85 over one month, 0.95 over three months, 0.92 over six months, 0.89 over one year and 0.86 over two years. They closed in the same direction on 53 of the last 66 fixing days.
Why do EURJPY and GBPJPY sometimes move differently?
Because EURJPY divided by GBPJPY is EURGBP. When the euro and the pound move apart, the two crosses split. From September 29 to October 30, 2026, EURGBP fell from 0.857 to 0.834, so EURJPY fell 1.53% while GBPJPY rose 1.23% with USDJPY almost flat.
Which is more volatile, EURJPY or GBPJPY?
GBPJPY moves more pips: an average of 74.4 pips a day over three months against 58.7 for EURJPY, and 68.0 against 51.1 over one year. In percentage terms they are close, 0.53% against 0.51% daily volatility over three months, because GBPJPY trades at a higher price.
Is the pip value the same on EURJPY and GBPJPY?
Yes. Both are quoted in yen, so 1.0 standard lot is worth 1,000 yen per pip on each, about $6.36 at the October 30, 2026 USDJPY rate of 157.25. The pip value changes only when USDJPY moves.
Can I trade EURJPY and GBPJPY at the same time?
Yes, but buying both is close to one bigger trade. At a 0.95 correlation, two positions risking 1% each swing like about 1.97% of risk. Give them one risk budget and split it, or pick the cleaner chart.
Is EURJPY correlated with USDJPY?
Yes. Over three months to October 30, 2026, both EURJPY and GBPJPY had a 0.87 correlation with USDJPY. Over one year EURJPY read 0.72 and GBPJPY 0.68, and over one month the link dropped to 0.48 and 0.54 as euro and pound moves dominated.
Risk Disclaimer: Trading stocks, options, futures, forex, commodities, and cryptocurrencies involves substantial risk of loss and is not suitable for every investor. Past performance does not guarantee future results. This article is for educational purposes only and does not constitute financial advice. You should carefully consider your financial situation and risk tolerance before trading. Never trade with money you cannot afford to lose. Correlation readings change over time and are calculated from daily ECB reference rates, which can differ from your broker's prices.