USDCHF
USDCHF Correlation: EURUSD vs USDCAD, Which Pair Mirrors the Swissie Better?
USDCHF moves most strongly against EURUSD, NZDUSD and GBPUSD, and most strongly with USDCAD. On ECB reference rates to October 27, 2026, its daily returns had a -0.83 correlation with EURUSD and 0.60 with USDCAD over one year. Over the last three months the gap closed: -0.60 with EURUSD and 0.63 with USDCAD.
This comparison puts the two classic USDCHF partners side by side: which one mirrors the Swissie better, why the EURUSD link weakened in October, how much risk you stack when you trade USDCHF next to either one, and how to size each leg when the pip values are all different. You can check the current readings on the free EURUSD vs USDCHF correlation page and the USDCAD vs USDCHF correlation page.
What moves USDCHF
USDCHF is the price of one US dollar in Swiss francs. Traders call the pair the Swissie. Two forces drive it. The first is the US dollar: when the dollar strengthens against everything, USDCHF and USDCAD rise while EURUSD, GBPUSD and NZDUSD fall. That shared dollar leg is what the correlation coefficient picks up, and it is why US inflation, jobs and FOMC meeting days tend to move all of these pairs together.
The second force is the franc itself. The Swiss National Bank sets the SNB policy rate and, as its monetary policy page explains, may also use other measures to influence the exchange rate. The franc is also widely bought as a safe haven in stressed markets. On a franc day, USDCHF moves while the dollar barely changes elsewhere, and the EURCHF cross shows it best.
A coefficient of -1 means two pairs always move in opposite directions, 0 means no linear link and +1 means they always move together. Over the last three months, USDCHF and EURUSD closed in opposite directions on 50 of 66 ECB fixing days (76%), while USDCHF and USDCAD closed in the same direction on 53 of 66 (80%).
USDCHF correlation table: every major pair
The inputs are ECB euro reference rates (see the ECB reference rates page) loaded through the Frankfurter exchange rate API, converted to dollar pairs and compared as daily percentage returns. All windows end on October 27, 2026.
| USDCHF vs | 1 month | 3 months | 6 months | 1 year |
|---|---|---|---|---|
| EURUSD | -0.14 | -0.60 | -0.74 | -0.83 |
| USDCAD | 0.28 | 0.63 | 0.62 | 0.60 |
| GBPUSD | -0.15 | -0.59 | -0.70 | -0.73 |
| NZDUSD | -0.43 | -0.69 | -0.70 | -0.73 |
| AUDUSD | 0.03 | -0.35 | -0.52 | -0.59 |
| USDJPY | 0.48 | 0.45 | 0.47 | 0.57 |
| EURCHF | 0.71 | 0.67 | 0.65 | 0.62 |
| CHFJPY | -0.72 | -0.26 | -0.37 | -0.36 |
How to read it in practice:
- Below about -0.7: a long in the other pair largely offsets your USDCHF long, and a short repeats it. That was EURUSD, GBPUSD and NZDUSD on six months and one year.
- Above about 0.6: a long in the other pair repeats your USDCHF long. That is USDCAD on every window from three months up. See the EURUSD vs USDCAD correlation page for how the two partners relate to each other (-0.56 over three months).
- A high EURCHF reading: when USDCHF tracks EURCHF closely, the franc is the story, not the dollar. Over one month that reading (0.71) was far stronger than EURUSD (-0.14).
EURUSD vs USDCAD: which pair mirrors USDCHF better?
Here are the two partners side by side, from the same ECB data. Pip values use the October 27, 2026 rates (USDCHF 0.8286, EURUSD 1.1150, USDCAD 1.4023) and the average daily move is the absolute fix to fix change over the last three months.
| Measure | EURUSD | USDCAD |
|---|---|---|
| Direction vs USDCHF | Opposite (inverse) | Same (positive) |
| Correlation, 1 year | -0.83 | 0.60 |
| Correlation, 3 months | -0.60 | 0.63 |
| Days in line with USDCHF, 1 year | 202 of 255 (79%) | 193 of 255 (76%) |
| Days in line with USDCHF, 3 months | 50 of 66 (76%) | 53 of 66 (80%) |
| Average daily move, 3 months | 26.5 pips | 28.3 pips |
| Pip value per 1.0 lot | $10 | about $7.13 |
| Change since Oct 20, 2025 | -4.33% (1.1655 to 1.1150) | -0.15% (1.4044 to 1.4023) |
For the same window, USDCHF averaged 24.2 pips a day and rose 4.53%, from 0.7927 to 0.8286. So over a full year EURUSD was the better mirror: its moves were almost the exact opposite of USDCHF, both in daily correlation and in the size of the yearly move. USDCAD shares the dollar leg but also carries the Canadian dollar and oil, which is why its one year reading stayed near 0.60 (the USDCAD and oil correlation article covers that link, and the Bank of Canada key interest rate page shows its policy decisions).
Over the last three months the answer flipped by a small margin: USDCAD (0.63) was slightly closer than EURUSD (-0.60), and it agreed with USDCHF on more days. The verdict for traders: use EURUSD as the default mirror, but read the three month and one month tabs before you treat it as a hedge.
Why the EURUSD link weakened in October 2026
Rolling three month correlations, same ECB data, show how stable the EURUSD mirror was for most of the year and how fast it slipped:
| Rolling 3 month window ending | USDCHF vs EURUSD | USDCHF vs USDCAD |
|---|---|---|
| Jan 20, 2026 | -0.86 | 0.43 |
| Apr 21, 2026 | -0.92 | 0.69 |
| Jun 19, 2026 | -0.92 | 0.68 |
| Sep 16, 2026 | -0.88 | 0.73 |
| Oct 15, 2026 | -0.62 | 0.66 |
| Oct 27, 2026 | -0.60 | 0.63 |
The cause shows up in EURCHF. On the ECB fixes it climbed to 0.9461 on September 29, 2026, then fell to 0.9239 by October 27, a 2.3% gain for the franc against the euro. In the same weeks EURUSD dropped from 1.1355 to 1.1150, yet USDCHF slipped from 0.8332 to 0.8286 instead of rising. When the franc strengthens against both the euro and the dollar, USDCHF and EURUSD can fall together, and the mirror breaks.
That is the general rule for this pair: the EURUSD link is strongest when the US dollar is the story and weakest when the franc has its own, such as an SNB decision or a rush into safe havens. A one month reading of -0.14 says the last few weeks were franc weeks.
How much risk you stack with USDCHF and a second pair
Say you hold USDCHF and one other pair, each sized to risk 1% of your account. If both stops are hit you lose 2%, whatever the correlation. What correlation changes is how often the two win and lose together. For two equal positions, the combined swing grows with the square root of 2 + 2 × correlation, in units of one position's risk:
| Second trade next to a USDCHF long | Correlation of the two positions | Combined swing of 1% + 1% |
|---|---|---|
| Short EURUSD (3 months) | 0.60 | about 1.79% |
| Long USDCAD (3 months) | 0.63 | about 1.81% |
| Short EURUSD (1 year) | 0.83 | about 1.91% |
| Short EURUSD (rolling high, Apr 2026) | 0.92 | about 1.96% |
| Long EURUSD (3 months) | -0.60 | about 0.89% |
A USDCHF long next to a EURUSD short or a USDCAD long behaves close to one 2% dollar bet. Buying USDCHF and EURUSD together does the opposite: the two partly cancel, so you pay two spreads for a smaller net position, and on franc days both can lose at once. The rule of thumb: one view, one risk budget. The guide to using currency correlation in forex explains the same math with more pairs.
Sizing USDCHF, EURUSD and USDCAD from one budget
The three pairs pay different amounts per pip. EURUSD has the dollar as the quote currency, so 1.0 lot is always $10 a pip. USDCHF and USDCAD pay 10 francs or 10 Canadian dollars a pip, which converts to about $12.07 and $7.13 at the October 27 rates. The formula is lots = risk money ÷ (stop in pips × pip value). Here are lots at 1% risk with a 20 pip stop, close to each pair's median daily move:
| Account (1% risk) | USDCHF | EURUSD | USDCAD |
|---|---|---|---|
| $1,000 ($10) | 0.04 lot ($10) | 0.05 lot ($10) | 0.07 lot ($10) |
| $5,000 ($50) | 0.20 lot ($48) | 0.25 lot ($50) | 0.35 lot ($50) |
| $10,000 ($100) | 0.41 lot ($99) | 0.50 lot ($100) | 0.70 lot ($100) |
| $25,000 ($250) | 1.03 lots ($249) | 1.25 lots ($250) | 1.75 lots ($250) |
The same stop needs 0.41 lot on USDCHF but 0.70 lot on USDCAD. Copying one lot size across both pairs would put about 70% more money at risk on the USDCHF leg. Now the two pair case: a $10,000 account with one 1% budget of $100, a USDCHF long with a 25 pip stop and a USDCAD long with a 30 pip stop:
| Plan | USDCHF (25 pip stop) | USDCAD (30 pip stop) | Total at risk |
|---|---|---|---|
| Full 1% on each | 0.33 lot ($100) | 0.46 lot ($98) | $198 |
| One 1% budget, split 50/50 | 0.16 lot ($48) | 0.23 lot ($49) | $97 |
| Only the cleaner chart | 0.33 lot ($100) | none | $100 |
Lots are rounded down to the 0.01 step, so the dollar risk never goes above plan. Run your own numbers in the USDCHF lot size calculator, the USDCAD lot size calculator or the position size calculator. Our USDCHF lot size guide shows why the franc pip value moves with the rate.
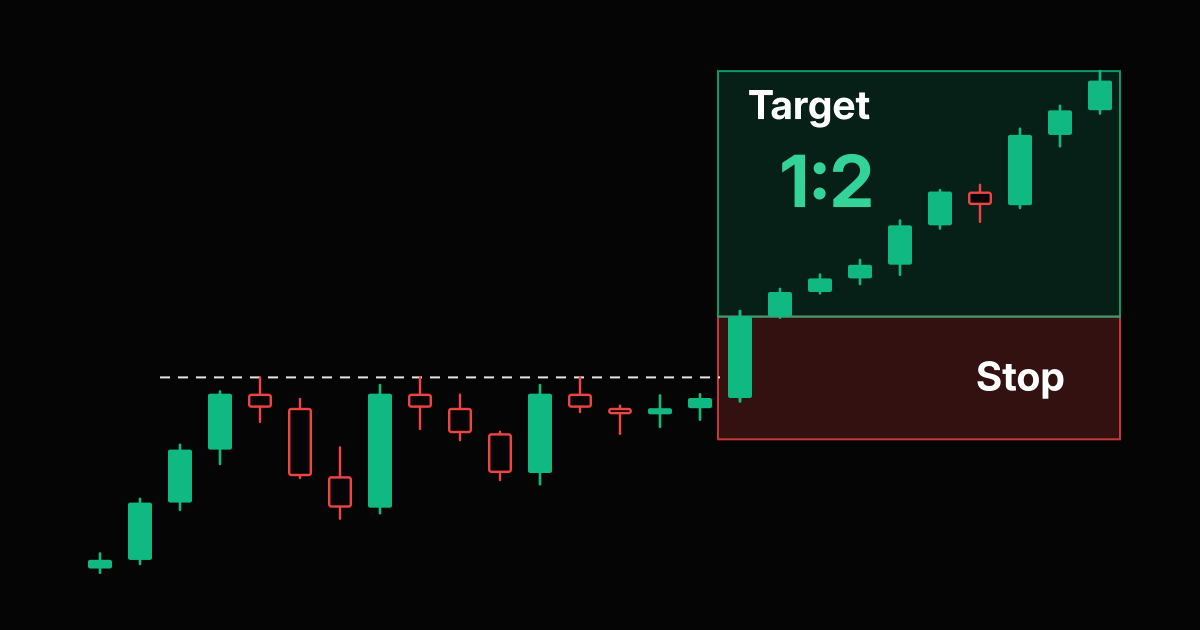
Using correlation to read a USDCHF breakout
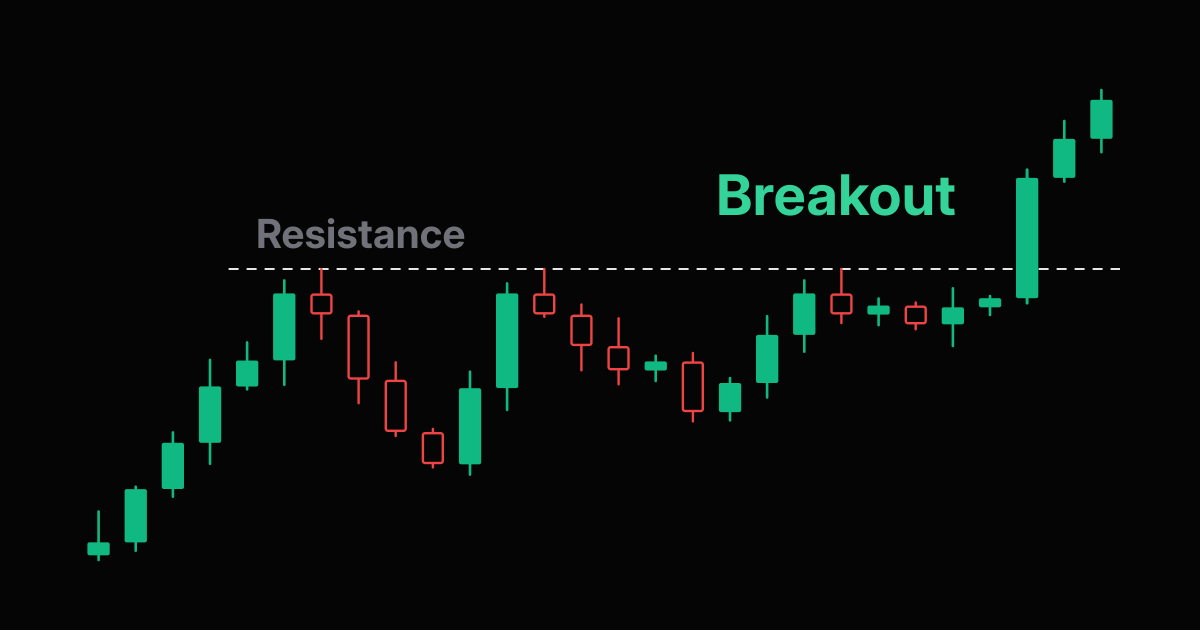
When USDCHF closes above a clear resistance line, look at EURUSD, USDCAD and EURCHF on the same timeframe before you buy:
- EURUSD breaking down and USDCAD breaking out: it is a dollar move. You have one idea on three charts, so pick the cleanest one or split one risk budget.
- EURCHF rising hard with EURUSD flat: it is a franc move, the franc is weakening on its own. It can be a good trade, but EURUSD will not confirm or hedge it.
- Only USDCHF moving: check the SNB calendar and the news. Single pair moves around a central bank decision can reverse fast.
None of this makes a breakout more likely to work. It tells you what you are actually betting on. Check the payoff with the risk reward calculator before you size, and compare with a commodity currency pair in our NZDUSD correlation article.
A five step USDCHF correlation check
- Open the forex correlation matrix and read USDCHF on the 1M and 3M tabs, not only 1Y.
- List every open trade with a reading above 0.6 or below -0.6 against USDCHF.
- Check EURCHF: if it drives USDCHF, the trade is about the franc, not the dollar.
- If it is a dollar idea, give all the related trades one risk budget and split it.
- Size each leg from its own stop and its own pip value: about $12.07 on USDCHF, $10 on EURUSD and about $7.13 on USDCAD per 1.0 lot at the October 27 rates.
Frequently Asked Questions
What pairs are correlated with USDCHF?
On ECB reference rates to October 27, 2026, USDCHF moved most against NZDUSD (-0.69), EURUSD (-0.60) and GBPUSD (-0.59) over three months, and most with USDCAD (0.63), EURCHF (0.67) and USDJPY (0.45). Over one year, EURUSD was the strongest mirror at -0.83.
Is USDCHF negatively correlated with EURUSD?
Yes. The correlation of daily returns was -0.83 over one year, -0.74 over six months, -0.60 over three months and -0.14 over one month to October 27, 2026. On rolling three month windows it held between -0.86 and -0.92 from January to mid September 2026, then weakened to -0.60.
Is USDCHF positively correlated with USDCAD?
Yes, because both pairs have the US dollar as the base currency. The reading was 0.63 over three months, 0.62 over six months and 0.60 over one year to October 27, 2026, and the two closed in the same direction on 53 of 66 ECB fixing days in the last three months.
Which is a better hedge for USDCHF, EURUSD or USDCAD?
Over one year, EURUSD: a long EURUSD offset a long USDCHF more reliably (-0.83 against 0.60 for USDCAD). Over the last three months the two were close (-0.60 and 0.63) because Swiss franc moves against the euro weakened the EURUSD mirror. Check the current reading before relying on either.
Can I trade USDCHF and EURUSD at the same time?
Yes, but a long USDCHF and a short EURUSD are mostly the same US dollar bet. At a 0.60 correlation, two trades risking 1% each swing like about 1.79% of risk, and if both stops are hit you lose 2%. Give them one risk budget and split it.
What is the pip value of USDCHF?
The Swiss franc is the quote currency, so 1.0 lot (100,000 units) pays 10 francs per pip. At the October 27, 2026 ECB rate of 0.8286 that is about $12.07 per pip, against $10 on EURUSD and about $7.13 on USDCAD at 1.4023.
Risk Disclaimer: Trading stocks, options, futures, forex, commodities, and cryptocurrencies involves substantial risk of loss and is not suitable for every investor. Past performance does not guarantee future results. This article is for educational purposes only and does not constitute financial advice. You should carefully consider your financial situation and risk tolerance before trading. Never trade with money you cannot afford to lose. Correlation readings change over time and are calculated from daily ECB reference rates, which can differ from your broker's prices.