USDCAD
USDCAD Correlation in October 2026: Oil Near $108, and Why the Loonie Is Not Following
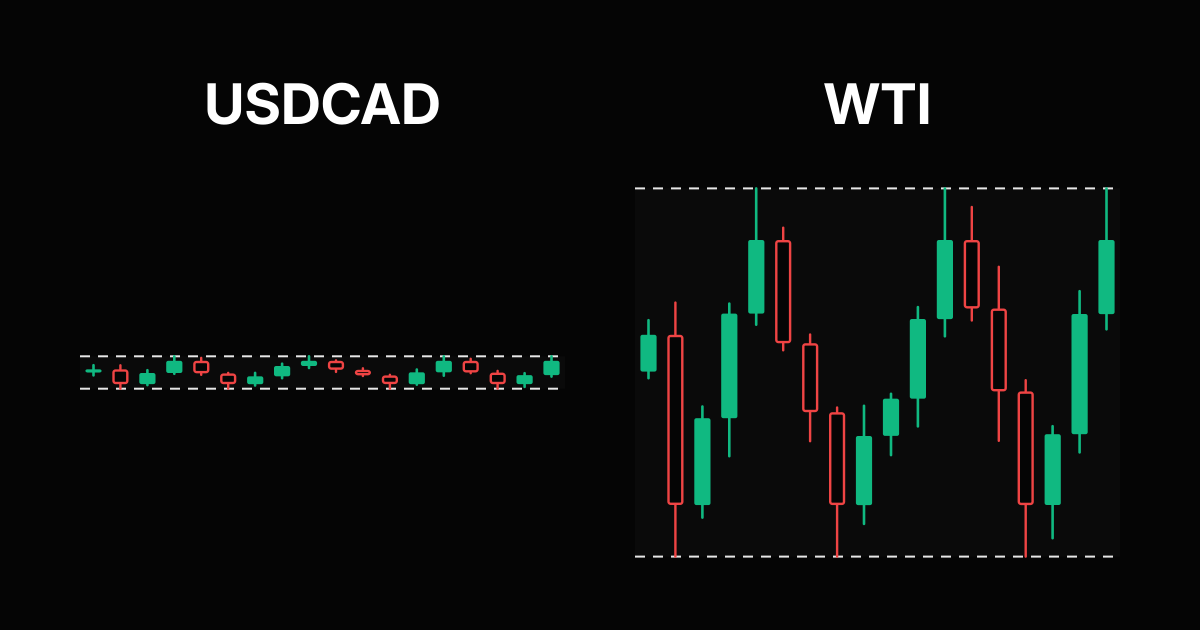
WTI crude closed at $107.89 a barrel on October 20, 2026, up from $58.30 a year earlier and from $86.04 in late July. The textbook says a strong oil rally should lift the Canadian dollar and push USDCAD down. It has not. On ECB reference rates, USDCAD was 1.4046 on October 21, 2026, almost exactly where it was a year ago (1.4034) and 0.19% lower than three months ago.
This October 2026 update shows what USDCAD is actually correlated with right now, why the oil link has gone quiet, what to watch at the Bank of Canada decision on October 28, and how to size USDCAD so a correlated position does not double your risk. Every coefficient uses the same method and windows as the free SIWAI forex correlation tool.
Oil near $108, USDCAD flat
Canada is a large oil exporter, so traders often treat the Canadian dollar as an oil currency: crude up, loonie up, USDCAD down. Over the last year the numbers tell a different story.
| WTI crude (spot) | USDCAD (ECB based) | |
|---|---|---|
| About one year ago (Oct 17, 2025) | $58.30 | 1.4034 |
| About three months ago (Jul 21, 2026) | $86.04 | 1.4073 |
| Latest (WTI Oct 20, USDCAD Oct 21, 2026) | $107.89 | 1.4046 |
| Change over one year | +85.1% | +0.09% |
| Change over three months | +25.4% | -0.19% |
| Typical daily move, 3 months (standard deviation) | 4.0% | 0.28% |
WTI figures are the daily Cushing spot price from the St. Louis Fed FRED series DCOILWTICO. USDCAD comes from ECB euro reference rates loaded through the Frankfurter exchange rate API and converted to a dollar pair, the same source the SIWAI correlation tool uses. In three months USDCAD stayed between 1.3740 and 1.4262, while WTI swung between $76.78 and $110.01.
USDCAD correlation readings in October 2026
The table shows the correlation coefficient of daily percentage returns between USDCAD and each market, for windows ending October 21, 2026. A reading of +1 means the two always move together, -1 means they always move opposite and 0 means no linear link.
| USDCAD vs | 1 month | 3 months | 6 months | 1 year |
|---|---|---|---|---|
| NZDUSD | -0.66 | -0.69 | -0.64 | -0.65 |
| USDCHF | 0.39 | 0.63 | 0.63 | 0.60 |
| EURUSD | -0.35 | -0.58 | -0.60 | -0.61 |
| GBPUSD | -0.44 | -0.58 | -0.61 | -0.59 |
| AUDUSD | -0.46 | -0.50 | -0.53 | -0.59 |
| USDJPY | 0.23 | 0.40 | 0.35 | 0.35 |
| WTI crude | -0.12 | -0.14 | -0.10 | 0.02 |
What the table says:
- USDCAD is trading as a US dollar pair. Its strongest links are with the other dollar pairs, led by NZDUSD at -0.69 over three months. The minus sign only means the dollar sits on opposite sides of the two quotes. Over those three months USDCAD and NZDUSD closed in opposite directions on 50 of 66 days. See the NZDUSD vs USDCAD page and USDCAD vs USDCHF page.
- The oil link is close to zero. USDCAD against WTI daily returns reads -0.14 over three months and 0.02 over one year. The sign is the textbook one on short windows, but the size is too small to trade on.
- Big oil days were a coin flip. In the last three months WTI rose more than 2% on 17 days, and USDCAD fell on only 9 of them. On the 14 days WTI fell more than 2%, USDCAD rose on 11.
One honest caveat: ECB reference rates are fixed in the European afternoon (published around 16:00 CET, see the ECB reference rates page), while the WTI spot price is a US close. That timing gap weakens any daily FX and oil correlation a little. It does not explain a year where oil gained 85% and USDCAD finished flat.
Why the oil link has faded
USDCAD has two legs. The Canadian leg carries oil, Canadian data and the Bank of Canada. The US leg carries the Federal Reserve and the broad dollar. When the dollar is the bigger story, the US leg drowns out the oil leg, and USDCAD lines up with EURUSD, GBPUSD and NZDUSD instead of crude.
The rolling numbers show the link coming and going. Measured on rolling three month windows, the USDCAD and WTI correlation was -0.27 in mid February 2026, turned positive at 0.35 in May 2026 (the opposite of the textbook) and was back near -0.11 by mid October 2026. A link that flips sign within a few months is not a rule you can build a trade on. It is a reading you check.
| Rolling 3 month window ending | USDCAD vs WTI |
|---|---|
| Feb 17, 2026 | -0.27 |
| May 20, 2026 | 0.35 |
| Jul 17, 2026 | 0.04 |
| Aug 17, 2026 | -0.23 |
| Oct 14, 2026 | -0.11 |
For a dollar read on oil itself, compare crude with the dollar index on the DXY vs WTI correlation page. The full method for reading these numbers is in the guide to using correlation in forex.
What to watch: the Bank of Canada on October 28
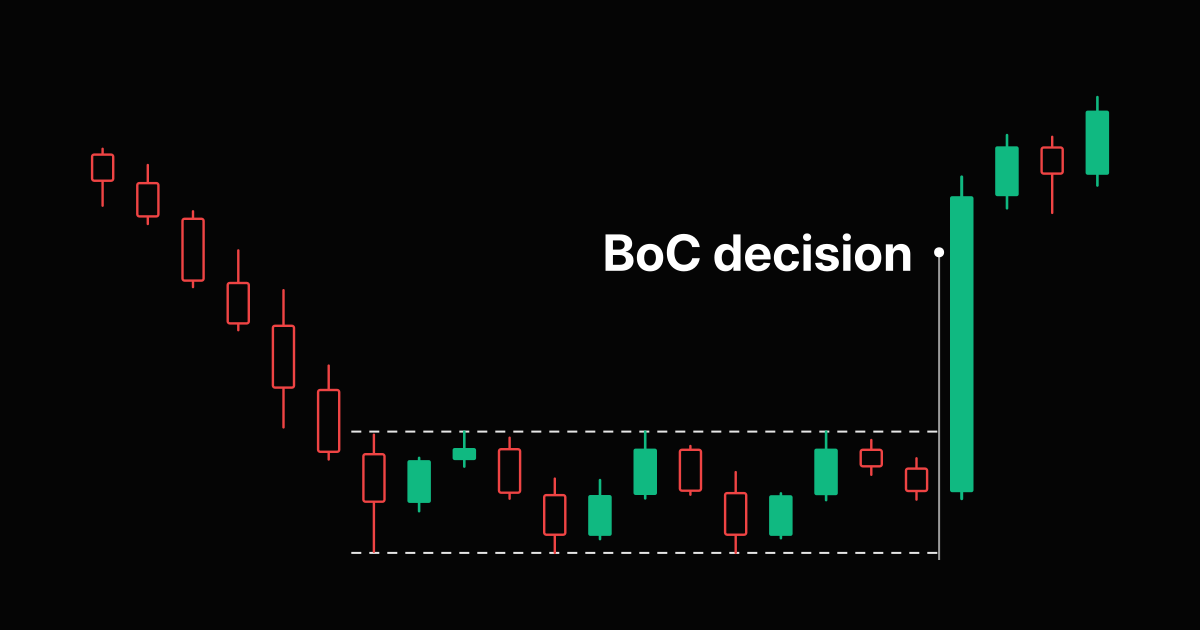
The Bank of Canada's next interest rate announcement and Monetary Policy Report is on Wednesday, October 28, 2026 at 09:45 ET. Its policy rate page shows the target at 2.25%, unchanged at every 2026 decision so far, including September 2. The only other scheduled decision this year is December 9.
A rate decision is a Canadian leg event. It is one of the few days when USDCAD can move on its own and break away from the other dollar pairs. That makes it the day the correlation table above is least reliable, so do not assume a USDCAD position is hedged or doubled by a NZDUSD or USDCHF position into the announcement.
Holding USDCAD with other dollar pairs
Because USDCAD is trading as a dollar pair, a long USDCAD next to a short NZDUSD or a long USDCHF is mostly the same bet. With two positions that each risk 1% of the account, the typical swing of the pair is about the square root of (1 + 1 + 2 × correlation) percent:
| Two 1% positions | 3 month correlation of the positions | Behaves like |
|---|---|---|
| Long USDCAD and short NZDUSD | 0.69 | about 1.84% |
| Long USDCAD and long USDCHF | 0.63 | about 1.81% |
| Long USDCAD and short WTI | 0.14 | about 1.51% |
Shorting NZDUSD flips the sign of the -0.69 reading, so the two positions move together at +0.69. Either way, if both stops are hit you still lose the full 2%. If both trades express one view on the US dollar, give that view one risk budget and split it.
Sizing USDCAD: a pip is not $10
USDCAD is quoted in Canadian dollars, so one pip on 1.0 lot (100,000 units) is worth 10 CAD. At 1.4046 that is 10 ÷ 1.4046 = about $7.12 per pip, $0.71 on 0.10 lot and about $0.07 on 0.01 lot. The same pip stop therefore needs a bigger position on USDCAD than on EURUSD to risk the same dollars. Example with a $10,000 account and a 1% budget of $100:
| Pair | Stop | Pip value of 1.0 lot | Lots | Money at risk |
|---|---|---|---|---|
| USDCAD | 40 pips | about $7.12 | 0.35 | about $99.67 |
| EURUSD | 40 pips | $10 | 0.25 | $100 |
Lots are rounded down to the 0.01 step so the risk never goes above plan, and the USDCAD pip value moves a little as the rate moves. Run your own numbers in the USDCAD lot size calculator or the position size calculator. The full method, including accounts in other currencies, is in how to calculate lot size in forex.
A five step USDCAD check for this week
- Read the 1M and 3M USDCAD readings in the forex correlation matrix instead of assuming the oil rule.
- Decide whether your idea is about the US dollar, the Canadian dollar or oil.
- If it is a dollar idea, count USDCAD and other dollar pairs as one risk budget.
- Size USDCAD at about $7.12 per pip per 1.0 lot at today's rate, not $10.
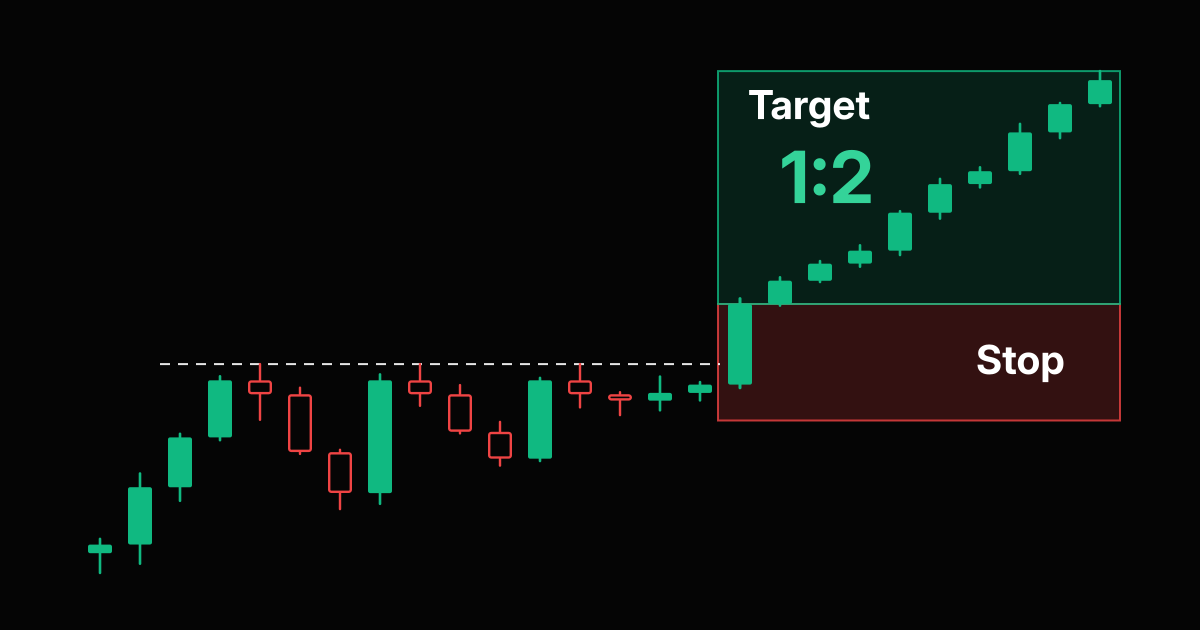
- Mark October 28 at 09:45 ET, and check the trade with the risk reward calculator before the announcement. For more on how pairs drift apart, read AUDUSD vs EURUSD correlation.
Frequently Asked Questions
Is USDCAD correlated with oil?
Only weakly right now. On daily returns to October 2026, USDCAD against WTI crude read -0.12 over one month, -0.14 over three months, -0.10 over six months and 0.02 over one year. The sign on short windows matches the textbook (oil up, USDCAD down), but the link is too small to trade on.
Why has USDCAD not fallen with oil above $100?
Because USDCAD has been trading mainly as a US dollar pair. WTI rose from $58.30 to $107.89 in the year to October 20, 2026, while USDCAD went from 1.4034 to 1.4046 on ECB based rates. Its strongest links are with other dollar pairs such as NZDUSD and USDCHF, not with crude.
Which pair is most correlated with USDCAD?
Among the majors, NZDUSD, at -0.69 over the three months to October 21, 2026. The minus sign only reflects that the dollar is on opposite sides of the two quotes. USDCHF was next with +0.63, followed by EURUSD and GBPUSD at -0.58.
When is the next Bank of Canada rate decision?
Wednesday, October 28, 2026 at 09:45 ET, together with the Monetary Policy Report. The policy rate is 2.25% and has been unchanged at every 2026 decision so far. The last scheduled decision of the year is December 9.
How much is one pip on USDCAD?
One pip on 1.0 lot is 10 Canadian dollars. At a USDCAD rate of 1.4046 that is about $7.12, about $0.71 on 0.10 lot and about $0.07 on 0.01 lot. The dollar value changes slightly as the rate moves.
Can I hold USDCAD and NZDUSD trades at the same time?
Yes, but a long USDCAD and a short NZDUSD are mostly the same US dollar bet, with a position correlation of about 0.69 over three months. Two trades risking 1% each then swing like about 1.84% of risk. Give one dollar view one risk budget and split it.
Risk Disclaimer: Trading stocks, options, futures, forex, commodities, and cryptocurrencies involves substantial risk of loss and is not suitable for every investor. Past performance does not guarantee future results. This article is for educational purposes only and does not constitute financial advice. You should carefully consider your financial situation and risk tolerance before trading. Never trade with money you cannot afford to lose. Correlation readings change over time and are calculated from daily ECB reference rates and FRED oil prices, which can differ from your broker's prices.