candlestick patterns
The Most Reliable Candlestick Patterns, and What the Research Actually Says
Traders hunt for the most reliable candlestick patterns because a single candle looks like a shortcut. The honest answer is less exciting: no candlestick by itself is a durable edge. Academic tests and large universe backtests usually find hit rates near market drift once you control for trend. What still works is using a short list of well defined candles as confirmation inside a larger setup, then sizing risk like a grown up.
This guide sorts what the research actually says, which patterns deserve a place on a cheat sheet, how to confirm them, and how to turn a candle into a stop, target, and lot size with SIWAI tools.
What the research actually says about candlestick reliability
Candlestick charts go back to Japanese rice markets. Modern education sources such as Wikipedia's candlestick pattern overview catalog dozens of named shapes. Reliability is a different question. Peer reviewed work by Marshall, Young, and Rose (2006) on Dow stocks, and a related 2008 study on Japanese equities, found little predictive value for candlestick rules when costs and controls are honest. More recent large sample tests across thousands of stocks reach a similar conclusion: once you match the same trend regime without the candle, most patterns add little or nothing.
Thomas Bulkowski's Top 10 Performing Candlesticks ranking is useful as a trader facing catalog, not as a guarantee. He ranks patterns by post breakout move and notes that a high reversal rate is not the same as a large follow through. Rare patterns can flip often and then go nowhere. Common patterns can look dramatic and still behave near random after the next few bars.
Takeaway for discretionary traders: treat candlesticks as context and confirmation. Do not treat a hammer or engulfing print as a complete trade plan. Pair the candle with prior trend, a clear invalidation, and a measured target, the same discipline used for larger structures in Head and Shoulders Pattern: Bullish or Bearish?.
A practical cheat sheet: patterns worth knowing
You do not need 40 names. A short list covers most screens and keeps definitions sharp. Group them by job: single candle reversals, two candle reversals, and three candle stars.
- Hammer and hanging man. Small body near the high, long lower wick, little upper wick. Hammer is a bullish candidate after a decline. Hanging man is a bearish warning after a rally. Same shape, opposite bias. Location decides the name.
- Inverted hammer and shooting star. Small body near the low, long upper wick. Inverted hammer can signal buyers testing after a downtrend. Shooting star warns after an uptrend. See the full side by side in Inverted Hammer vs Shooting Star vs Hammer vs Hanging Man.
- Bullish and bearish engulfing. Second candle's body fully covers the prior body. Bullish engulfing after a decline shows buyers stepping through sellers. Bearish engulfing after a rally shows the opposite.
- Piercing line and dark cloud cover. Two candle crosses deep into the prior body without a full engulf. Useful when you want a clear midpoint rule without waiting for a full wrap.
- Morning star and evening star. Three candles: impulse, indecision or gap candle, then a close well into the first body. Stars are rarer and often clearer than single wicks when the third candle confirms.
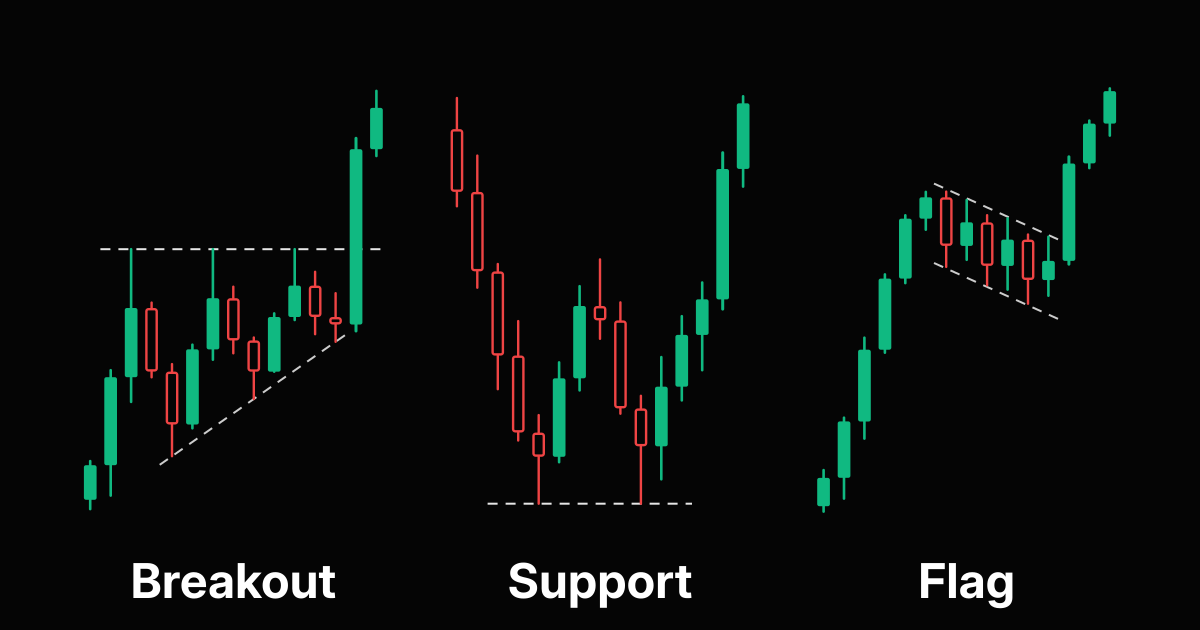
Notice the theme. The candle is the trigger on the right of a structure you already marked. A lonely doji in the middle of a range is noise. A bullish engulfing that closes through a pre marked resistance after a tight coil is a candidate.
Confirmation rules that filter noise
Research keeps saying isolated candles fail. Traders who still use them successfully usually stack filters like these:
- Prior trend. Reversal candles need something to reverse. A hammer after a clear decline beats a hammer in a choppy box.
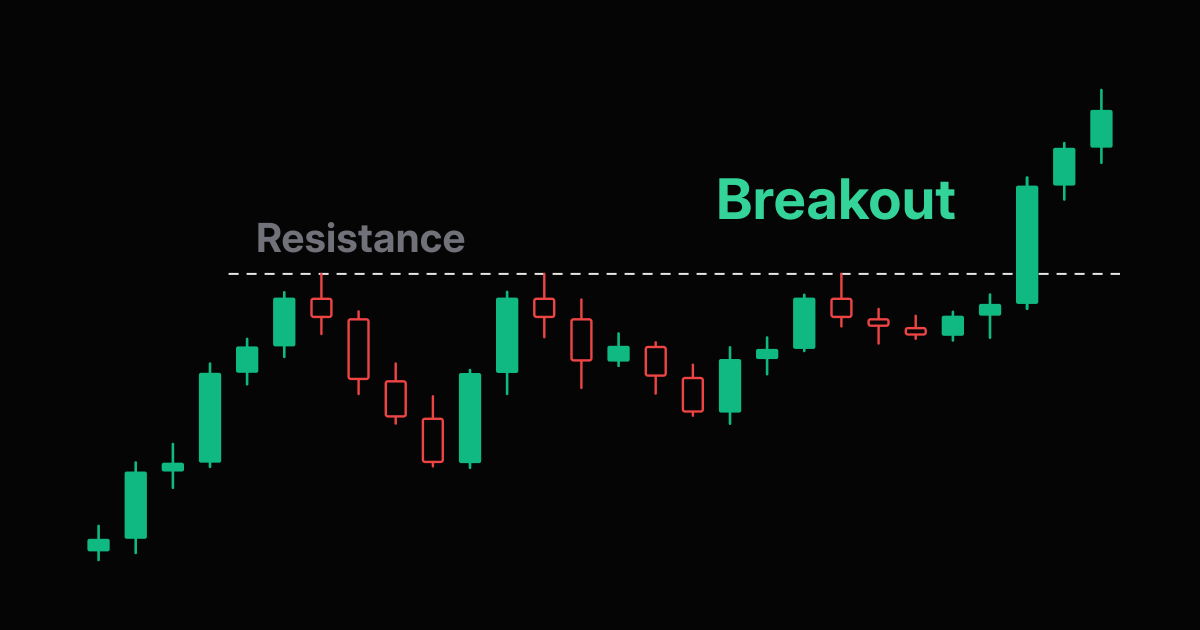
- Level confluence. Prefer candles that print at support, resistance, a moving average you already respect, or a measured pattern boundary. The candle answers who won the bar. The level answers why this bar matters.
- Close based confirmation. For many setups, wait for the next bar to close in the trade direction, or for the signal candle to close beyond the level. A long wick that fails on the next open is a common trap.
- Session and news context. A huge candle into a scheduled print can be liquidity, not a clean reversal. Event weeks still use the same definitions, but you size smaller and demand clearer closes, as in Chart Patterns to Watch as October 2026 Opens.
Turn a candle into stop, target, and lot size
A pattern without risk math is a screenshot. Place the stop on the invalidation side of the candle: below the hammer low for a long, above the shooting star high for a short. Measure a target from structure (prior swing, measured move, or a fixed multiple of risk). Then size the position so dollar risk matches your rule.
Work the numbers before entry with the risk reward calculator and the workflow in How to Calculate Risk Reward Ratio Before Entering a Trade. Convert stop distance into lots with the position size calculator or a pair specific EURUSD lots calculator. For index CFDs, SIWAI uses $1 per point per 1.0 lot on US30, NAS100, and SPX500 when you translate stop points into dollars.
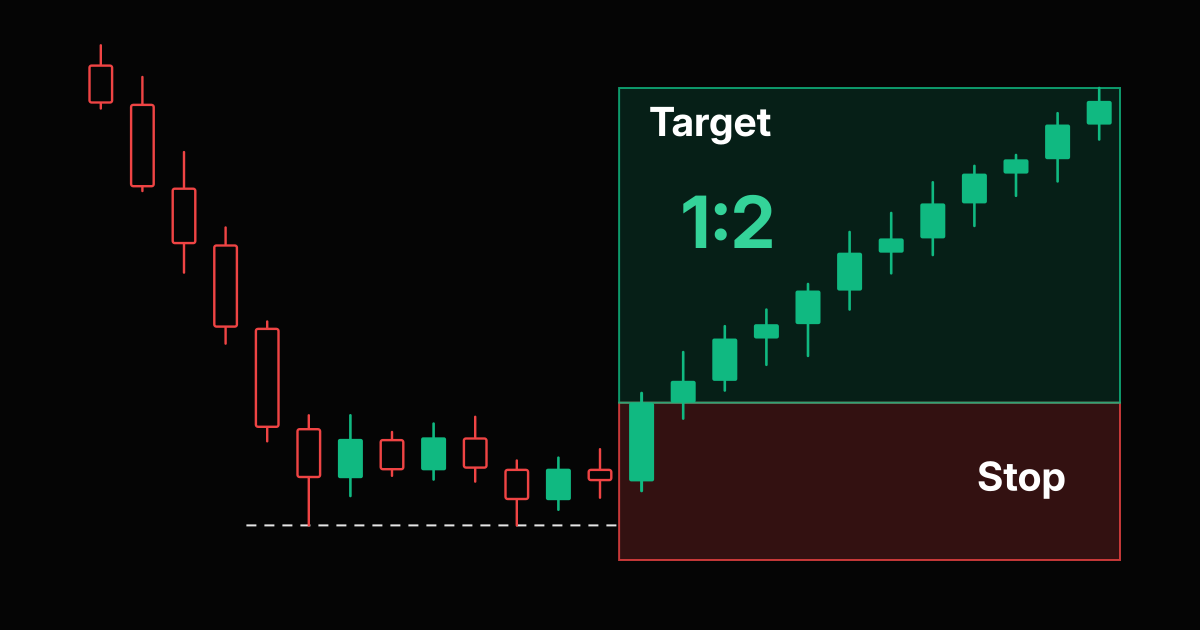
If the wick is huge, the stop is far, and a 1% risk rule forces a tiny size. That is a feature. Skipping oversized wick trades keeps you from betting the account on one noisy bar. Small account tables in How Many Lots Can I Trade With $100, $500 or $1,000? make that tradeoff concrete.
How to scan for reliable setups without hunting every chart
Naming candles by hand across a universe is slow. A scanner surfaces candidates so you review trend, level, and risk instead of drawing every ticker. That loop is the same idea as How to Scan Stocks for Chart Patterns Without Hours of Chart Hunting.
- Filter for instruments already near a level or completing a larger pattern.
- Confirm the candle definition (wick length, body wrap, star sequence) without renaming by hope.
- Require a close based confirmation rule you wrote before the session.
- Size from stop distance, then decide if the reward justifies the trade.
SIWAI's daily feed is built for that review: patterns across stocks and crypto, then tools for risk and lots. Candles become one gate in the checklist, not the whole strategy.
Common mistakes when chasing "reliable" candles
- Trading the name, not the context. A textbook hammer in the middle of nowhere is still a low quality trade.
- Confusing reversal rate with expectancy. A pattern that reverses often but pays 0.3R after costs is not an edge.
- Mixing lookalike candles. Hammer vs hanging man and inverted hammer vs shooting star share shapes. Trend location is the definition.
- Ignoring costs and slippage. Studies that look good on perfect fills fade once spreads and missed fills show up, especially on lower timeframes.
- Skipping lot math. The forex sizing walkthrough in How to Calculate Lot Size in Forex still applies when the entry signal is a candle instead of a neckline.
Frequently asked questions
What are the most reliable candlestick patterns?
There is no universal winner. Large sample tests often find little edge for isolated candles once trend is controlled. Traders still use hammers, engulfing candles, piercing or dark cloud pairs, and morning or evening stars as confirmation inside a larger setup with a clear stop and target.
Do candlestick patterns work according to research?
Academic studies such as Marshall, Young and Rose (2006) and related tests on Japanese equities found little predictive value for candlestick rules when controls are honest. Treat published reversal rates as descriptive, not as a promise of expectancy after costs.
Is the hammer more reliable than the doji?
It depends on context and your rules. A hammer after a decline at support with a confirming close is a clearer plan than a doji in the middle of a range. Reliability comes from the full checklist, not the candle name alone.
Should I trade candlestick patterns without confirmation?
Usually no. Wait for a close in your trade direction or a close beyond a pre marked level. Many failed candle trades are early entries on a wick that the next bar erases.
How do I size a trade after a candlestick signal?
Put the stop beyond the candle extreme, set a target from structure or a risk multiple, then compute lot size from account risk percent. Use SIWAI risk reward and lots calculators. For US30, NAS100 and SPX500, SIWAI uses $1 per point per 1.0 lot.
Where can I scan for candlestick and chart pattern setups?
SIWAI scans stocks and cryptos daily for chart patterns so you can review candle context, levels and risk without hunting every ticker by hand. Pair the feed with free position size and lots tools.
Risk Disclaimer: Trading stocks, options, futures, forex, and cryptocurrencies involves substantial risk of loss and is not suitable for every investor. Past performance does not guarantee future results. This article is for educational purposes only and does not constitute financial advice. You should carefully consider your financial situation and risk tolerance before trading. Never trade with money you cannot afford to lose.