bull flag
Bull Flag vs Bull Pennant vs Rising Wedge: How to Tell Them Apart Before the Breakout
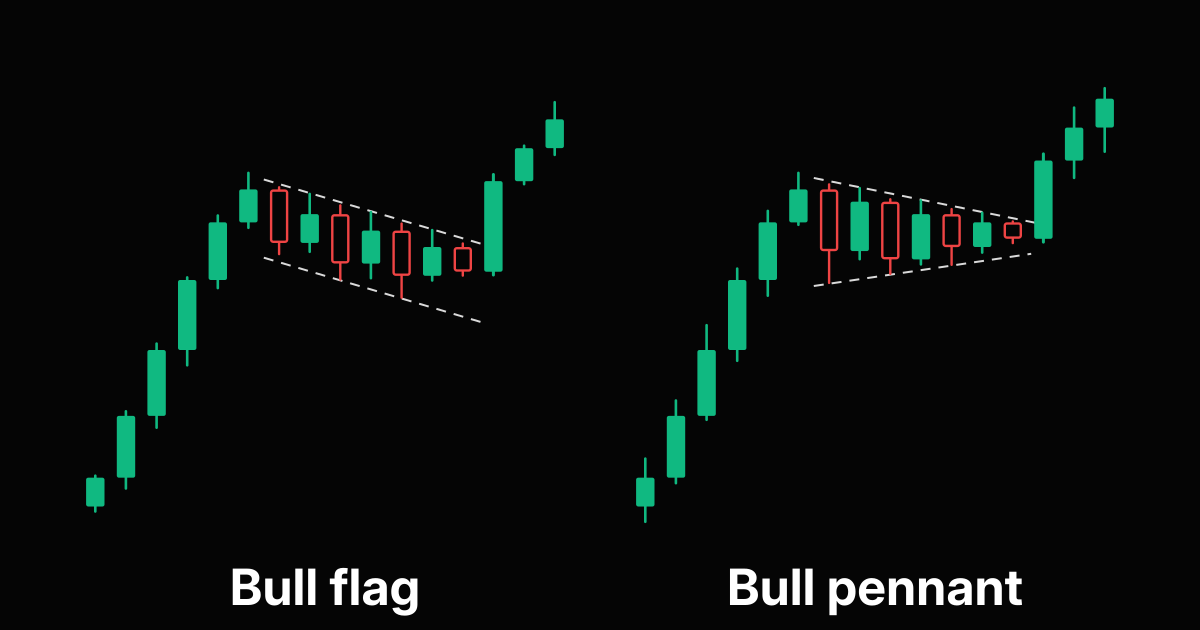
Bull flag vs bull pennant comes down to the shape of the pause. Both start with a steep rally called the flagpole. In a bull flag, price then drifts lower between two parallel lines, like a small channel tilted against the trend. In a bull pennant, price squeezes between two converging lines, like a tiny symmetrical triangle. Both are continuation patterns, and both trigger on a close above the upper line.
The pattern that fools traders is the rising wedge. It also has converging lines, but both lines slope up, and in an uptrend it often breaks down instead of up. This guide shows how to tell the three apart, what published pattern statistics actually say, and how to set entry, stop, target, and position size before the breakout candle closes.
Bull flag vs bull pennant: the short answer
Look at the two lines you draw around the pause. Parallel lines sloping down mean a flag. Lines that converge toward a point mean a pennant. Everything before the pause (a sharp, almost vertical advance) and after it (a breakout that resumes the advance) is the same. The Wikipedia entry on flag and pennant patterns puts it simply: the pennant is identical to the flag in setup and implications, and the only difference is converging trend lines instead of parallel ones.
| Pattern | Lines | Slope of the pause | Usual bias in an uptrend |
|---|---|---|---|
| Bull flag | Two parallel lines | Flat or down, against the pole | Continuation up |
| Bull pennant | Two converging lines | Roughly neutral, upper falls and lower rises | Continuation up |
| Rising wedge | Two converging lines | Both lines slope up, lower line steeper | Often bearish reversal |
What is a bull flag?
A bull flag is a short pullback after a sharp rally, contained between two parallel trend lines that tilt down or sideways. The StockCharts ChartSchool guide to flags and pennants describes the flag as a small rectangle that slopes against the previous trend, and stresses that the pattern needs a sharp advance first, ideally on heavy volume. No pole, no flag.
Three details separate a clean bull flag from a messy pullback:
- A steep pole. The rally into the flag should be fast and nearly straight. A slow grind higher followed by a drift lower is just a range.
- A tight pause. Candles should stay inside the channel without wild wicks poking out. Thomas Bulkowski notes on his flag pattern page that tight flags perform better than loose ones that meander or look jagged.
- A shallow pullback. The flag should retrace only part of the pole. If the drift erases most of the rally, the buyers who built the pole are gone.
What is a bull pennant?
A bull pennant is the same pause drawn with converging lines. Each swing inside it is smaller than the last: lower highs against higher lows, so the range coils into a point. StockCharts calls it a small symmetrical triangle that begins wide and converges as it matures, with a slope that is usually neutral.
In practice, the pennant often forms when the pause is very short, so there is no room for a full channel. That is why many traders treat flags and pennants as one family and trade them with the same rules. The breakout trigger is a close above the falling upper line. The invalidation is a close below the rising lower line, or below the pennant low for a wider, more forgiving stop.
Bull pennant vs rising wedge: the look alike that breaks down
A rising wedge also converges, which is why it gets confused with a pennant. The difference is the direction of the lines. In a pennant, the upper line falls and the lower line rises. In a rising wedge, both lines climb, and the lower line climbs faster. According to the Wikipedia overview of wedge patterns, a rising wedge inside an ongoing uptrend is read as a bearish reversal, because each push higher gains less ground and demand is fading at higher prices.
Run this quick test on any converging pattern after a rally:
- Upper line falling, lower line rising: pennant. Plan for a breakout above the upper line.
- Both lines rising and squeezing together: rising wedge. Do not buy it as a pennant. Wait for the break and respect a close below the lower line.
- Pause lasting much longer than the pole: probably not a pennant at all. Bulkowski's pennant page says pennants are three weeks long or less, and longer patterns are symmetrical triangles, rising wedges, or falling wedges.
Duration rules differ by source. StockCharts allows one to 12 weeks on daily charts, ideally one to four, and reclassifies anything older as a rectangle or a symmetrical triangle. Bulkowski keeps both patterns at three weeks or less. On intraday charts, the idea scales down: the pause should be short relative to the pole.
Which is more reliable, a bull flag or a bull pennant?
The most quoted numbers come from Thomas Bulkowski's pattern statistics (his pennant figures are based on more than 1,600 trades). His bull market results, measured on the short price swing after the pattern rather than the ultimate high, look like this:
| Bulkowski statistic (upward breakouts) | Flags | Pennants |
|---|---|---|
| Breakout direction is upward | 60% of the time | 57% of the time |
| Break even failure rate | 44% | 54% |
| Average rise | 9% | 7% |
| Meets the measured price target | 46% | 35% |
On those numbers, flags held up somewhat better than pennants. Treat them as context, not a promise. They come from one researcher, one market, and specific identification rules. Your timeframe, instrument, and entry rule will produce different results. The useful lessons are the ones both sources agree on: a steep pole, a short and tight pause, and a confirmed close through the line matter more than which name you give the shape. For a broader look at how little single patterns prove on their own, see The Most Reliable Candlestick Patterns, and What the Research Actually Says.
How to trade a bull flag or pennant: entry, stop, target, size
Plan the trade while the pattern is still forming, so the breakout candle only has to confirm it.
- Entry: on a candle close above the upper line. A wick through the line that closes back inside is not a breakout.
- Stop: just under the flag or pennant low. If price falls back below the whole pause, the continuation story has failed.
- Target: StockCharts measures the flagpole and projects that length from the breakout point. Bulkowski's data shows the full projection is reached less than half the time, so many traders take partial profit at a fixed multiple of risk, such as 1:2, and trail the rest.
- Size: compute the lot size from the stop distance and your risk percent, never the other way around.
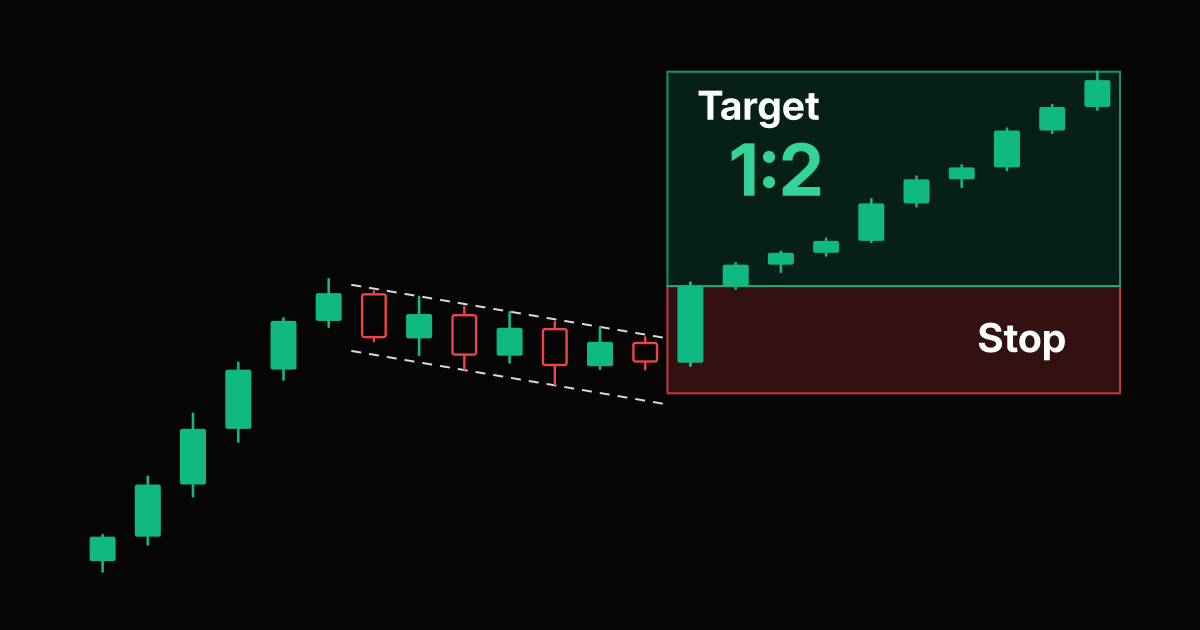
A worked example on NAS100, where 1.0 lot is $1 per point: a bull flag breaks out and the entry candle closes 60 points above the flag low. You place the stop just under that low, so the stop distance is about 60 points. With a $10,000 account and 1% risk, you can lose $100. Divide $100 by 60 points and you get 1.66 lots, rounded down. A 1:2 target sits 120 points above entry, worth about $200 at that size. These are illustration numbers for the arithmetic, not a forecast. US30 and SPX500 use the same $1 per point per 1.0 lot.
Run your own numbers in the position size calculator, the risk reward calculator, or the NAS100 lots calculator. The steps behind the math are in How to Calculate Risk Reward Ratio Before Entering a Trade and How to Calculate Lot Size in Forex.
Common mistakes with flags and pennants
- Calling every pullback a flag. Without a sharp pole, there is nothing to continue.
- Buying a rising wedge as a pennant. Check the direction of both lines before you name the pattern.
- Entering on the wick. Wait for the close. Fake breakouts often look strongest in the middle of the candle.
- Letting the pause run forever. A flag that lasts much longer than its pole has turned into a range. Reassess it as a rectangle or a triangle.
- Sizing from conviction. A beautiful flag does not justify a bigger loss. Keep the same risk percent on every trade.
How to find bull flags and pennants without hunting every chart
Flags and pennants are short, so they are easy to miss. By the time you flip to the right chart, the breakout candle may already be gone. A chart pattern scanner like SIWAI does the first pass for you across stocks, crypto, forex, indices, and commodities, so you spend your time checking the pole, the lines, and the stop distance instead of searching. The workflow is the same one described in How to Scan Stocks for Chart Patterns Without Hours of Chart Hunting, and it pairs well with the breakout setups collected in the breakout stocks vault.
For each candidate: confirm the pole is steep, draw the two lines, decide flag, pennant, or rising wedge, mark the stop under the pause, and size the trade before the close. If any step fails, skip it. Another clean setup usually appears soon. For a reversal pattern with the opposite logic, see Head and Shoulders Pattern: Bullish or Bearish?
Frequently asked questions
What is the difference between a bull flag and a bull pennant?
Both follow a steep rally called the flagpole and both are continuation patterns. A bull flag pauses between two parallel lines that slope down or sideways. A bull pennant pauses between two converging lines, like a small symmetrical triangle. Both trigger on a close above the upper line.
Which is more reliable, a bull flag or a bull pennant?
In Thomas Bulkowski's bull market statistics, flags did somewhat better: a 44% break even failure rate for upward breakouts versus 54% for pennants, and 46% of flags met the measured target versus 35% of pennants. Treat these as context from one dataset, not a guarantee for your market or timeframe.
How is a rising wedge different from a bull pennant?
A pennant has a falling upper line and a rising lower line. A rising wedge has two lines that both slope up, with the lower line rising faster. In an uptrend, a rising wedge is usually read as a bearish reversal, so do not buy it as if it were a pennant.
How long should a bull flag or pennant last?
Short. Bulkowski describes both as three weeks or less on daily charts. StockCharts allows one to 12 weeks, ideally one to four, and reclassifies longer patterns as rectangles or symmetrical triangles. On any timeframe, the pause should be short compared with the pole.
Where do you put the stop on a bull flag?
Most traders place the stop just under the low of the flag or pennant. If price closes back below the whole pause, the continuation idea has failed. Measure that distance, then size the position from your risk percent with a position size calculator.
How do you calculate the target of a bull flag or pennant?
The classic measured move takes the length of the flagpole and projects it from the breakout point. Because published statistics show that full target is reached less than half the time, many traders take partial profit at a fixed multiple of risk such as 1:2 and trail the rest.
Risk Disclaimer: Trading stocks, options, futures, forex, and cryptocurrencies involves substantial risk of loss and is not suitable for every investor. Past performance does not guarantee future results. This article is for educational purposes only and does not constitute financial advice. You should carefully consider your financial situation and risk tolerance before trading. Never trade with money you cannot afford to lose.