MSFT
MSFT vs QQQ Correlation After the November 2026 Tech Selloff: Why Microsoft Held Up
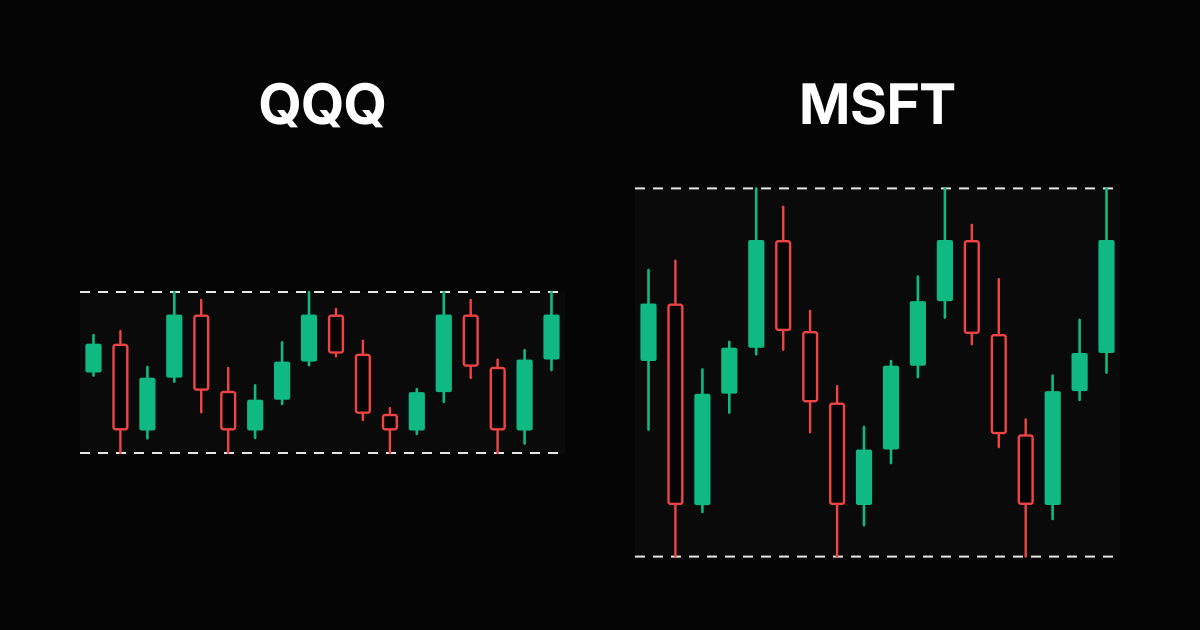
Microsoft and QQQ are positively correlated, but far less than most traders assume. On Yahoo Finance daily closes to November 6, 2026, the correlation of their daily returns was 0.53 over three months, 0.36 over one year and 0.52 over two years. Microsoft is a Nasdaq 100 heavyweight, yet over the past year it moved in the same direction as QQQ on only 158 of 252 trading days.
The November 5 tech selloff made the gap visible. QQQ fell 6.49% that day and Nvidia fell 9.26%, while Microsoft fell 3.58%. Over the month to November 6, QQQ lost 12.24% and MSFT gained 1.53%. This article puts the numbers side by side: correlation and beta by time frame, what happened around the October 28 earnings report and the November 5 rout, how much risk you stack holding both, and how to size each position. You can check the current reading on the free SIWAI MSFT vs QQQ correlation page.
What happened to tech stocks in early November
On Thursday, November 5, 2026, the Nasdaq 100 index dropped 6.3% and the S&P 500 fell 4.4%, both their worst days since April 2025, according to NBC News on the November 5 selloff. The report tied the drop to fears about the durability of the AI boom after the midterm election results, and to mixed earnings from chipmakers Qualcomm and Arm the night before. The Philadelphia semiconductor index fell 12.3%. NBC noted that the big cloud providers, Microsoft included, also fell, but less than the overall market.
A week earlier Microsoft had reported its fiscal first quarter. Per CNBC on Microsoft's October 28 results, adjusted earnings were $4.89 a share against $4.73 expected, revenue was $92.28 billion against $90.69 billion expected, and Azure revenue grew 48% to $33.17 billion. Free cash flow fell 27% to $18.63 billion as AI spending rose. The stock closed almost unchanged the next day, at $530.14 on October 29 against $531.01 on October 28.
| Daily close change | MSFT | QQQ | NVDA | SPY |
|---|---|---|---|---|
| Oct 30 | -1.55% | -3.47% | -4.22% | -1.77% |
| Nov 2 | -2.83% | -1.36% | -1.26% | -0.48% |
| Nov 4 | +6.68% | +0.97% | -3.17% | +1.65% |
| Nov 5 | -3.58% | -6.49% | -9.26% | -4.41% |
| Nov 6 | -0.99% | +1.40% | +2.78% | +0.31% |
| Oct 28 close to Nov 6 | -0.08% | -9.58% | -13.34% | -4.79% |
Read the rows one by one and the correlation story jumps out. On November 2 and November 6 Microsoft and QQQ went opposite ways, and on November 4 Microsoft rose almost seven times as much as the fund. Over the whole stretch from the earnings report to November 6, MSFT was flat while QQQ lost almost a tenth of its value.
MSFT vs QQQ correlation and beta by time frame
The inputs are daily closes adjusted for dividends from Yahoo Finance historical prices, compared as daily percentage returns. All windows end on November 6, 2026. The correlation coefficient says how closely the two move together. The beta says how big the MSFT move was, on average, for each 1% move in QQQ.
| Window | Start | Correlation | Beta to QQQ | Same direction days |
|---|---|---|---|---|
| 1 month | Oct 8, 2026 | 0.66 | 0.74 | 14 of 21 (67%) |
| 3 months | Aug 10, 2026 | 0.53 | 0.64 | 39 of 63 (62%) |
| 6 months | May 8, 2026 | 0.32 | 0.50 | 72 of 126 (57%) |
| 1 year | Nov 5, 2025 | 0.36 | 0.57 | 158 of 252 (63%) |
| 2 years | Nov 11, 2024 | 0.52 | 0.68 | 342 of 498 (69%) |
How to read it in practice:
- Around 0.5: a moderate link. QQQ explains part of the MSFT move, but a large share of each day belongs to Microsoft alone.
- It swings a lot: over the past year the rolling three month reading ranged from about 0.62 in mid November 2025 to about -0.04 in late July 2026.
- Selloffs pull it up: without November 5, the three month reading drops from 0.53 to 0.47. Big market days are when stocks move together most.
- Beta below 1: at 0.64 over three months, a 6.49% QQQ drop implied about 4.2% for MSFT. The real move on November 5 was 3.58%.
The tool page refreshes on its own schedule and window, so its reading can differ slightly from these figures. Use it as the current number before you trade.
MSFT, QQQ and the other big names side by side
| Measure | MSFT | NVDA | AAPL | SPY | QQQ |
|---|---|---|---|---|---|
| Correlation with QQQ, 3 months | 0.53 | 0.76 | 0.10 | 0.93 | 1.00 |
| Correlation with QQQ, 1 year | 0.36 | 0.71 | 0.20 | 0.93 | 1.00 |
| Beta to QQQ, 3 months | 0.64 | 1.38 | 0.10 | 0.57 | 1.00 |
| Daily volatility, 3 months | 1.68% | 2.48% | 1.37% | 0.85% | 1.37% |
| Daily volatility, 1 year | 2.12% | 2.42% | 1.56% | 0.85% | 1.34% |
| Change, 1 month | +1.53% | -19.02% | +0.57% | -4.99% | -12.24% |
| Change, 6 months | +28.34% | -13.07% | +16.93% | +0.19% | -7.55% |
Two things stand out. First, Microsoft is more volatile than QQQ (1.68% against 1.37% a day over three months) even though its correlation is only moderate. A fund of about a hundred stocks smooths out single company news, a single stock does not. Second, Nvidia is the name that has been driving QQQ lately, with a 0.76 correlation and a beta of 1.38, while Apple barely tracked the fund over the last three months.
Compare more pairs on the NVDA vs QQQ correlation page, the AAPL vs MSFT correlation page, the MSFT vs SPY correlation page or the full stock correlation matrix.
How much risk you stack holding both
Two positions that each risk 1% swing together like one bigger position when they are correlated. The combined swing is the square root of (2 + 2 times the correlation of the two position returns), in units of one position's risk. A long and a short flip the sign of the correlation.
| Positions, 1% risk each | Correlation used | Behaves like |
|---|---|---|
| Long MSFT and long QQQ | 0.53 (3 months) | about 1.75% of risk |
| Long MSFT and long QQQ | 0.36 (1 year) | about 1.65% of risk |
| Long MSFT, short QQQ as a hedge | 0.53 (3 months) | about 0.97% of risk |
| Long MSFT, short QQQ as a hedge | 0.36 (1 year) | about 1.13% of risk |
The surprise is the hedge. Shorting QQQ against a long Microsoft position barely lowers the risk, because the correlation is too weak to cancel much. You end up with two trades and about the same swing as one. A short QQQ hedge only helps on days like November 5, when everything falls together. When Microsoft moves on its own news, as on November 4, the hedge does nothing for you and can lose on both legs.
If you do hedge, size the QQQ leg by beta rather than by dollars. At a three month beta of 0.64, a $10,000 MSFT position lines up with about $6,400 of QQQ. The guide to using correlation explains the same stacking rule with currency pairs.
Position sizing MSFT, QQQ and NAS100
Shares = risk in dollars divided by the stop distance per share. Over three months MSFT moved $6.49 a day on average and QQQ $6.73. The table uses 1% risk, a $16 stop on MSFT (about 3% below the November 6 close of $530.61) and a $17 stop on QQQ (about 2.6% below $656.10), both roughly two and a half times the average daily move, rounded down to whole shares.
| Account | 1% risk | MSFT, $16 stop | QQQ, $17 stop |
|---|---|---|---|
| $5,000 | $50 | 3 shares ($48) | 2 shares ($34) |
| $10,000 | $100 | 6 shares ($96) | 5 shares ($85) |
| $25,000 | $250 | 15 shares ($240) | 14 shares ($238) |
| $50,000 | $500 | 31 shares ($496) | 29 shares ($493) |
If you trade the index as a CFD instead, NAS100 typically pays $1 per point on 1.0 lot. A 200 point stop with $100 at risk is 0.5 lot. Check your broker's contract size first, then run the numbers in the NAS100 lot size calculator, the MSFT lot size calculator, the QQQ lot size calculator or the position size calculator. The NAS100 lot size guide walks through the index math.
What to watch next
- Whether chips keep leading: while Nvidia and the semiconductor names drive QQQ, Microsoft's correlation with the fund can stay low. A broad rebound led by chips would pull QQQ away from MSFT again, this time upward.
- AI spending headlines: Microsoft told analysts it aims for over $50 billion in fiscal second quarter capital expenditures and finance leases. News on data center spending hits both the stock and the fund, which is when the correlation rises.
- The Fed in December: NBC reported that traders dialed back bets on a rate hike at the December 8 to 9 meeting, with odds around 60% after the selloff. A rate shock is a market wide event, the kind of day when MSFT and QQQ move together.
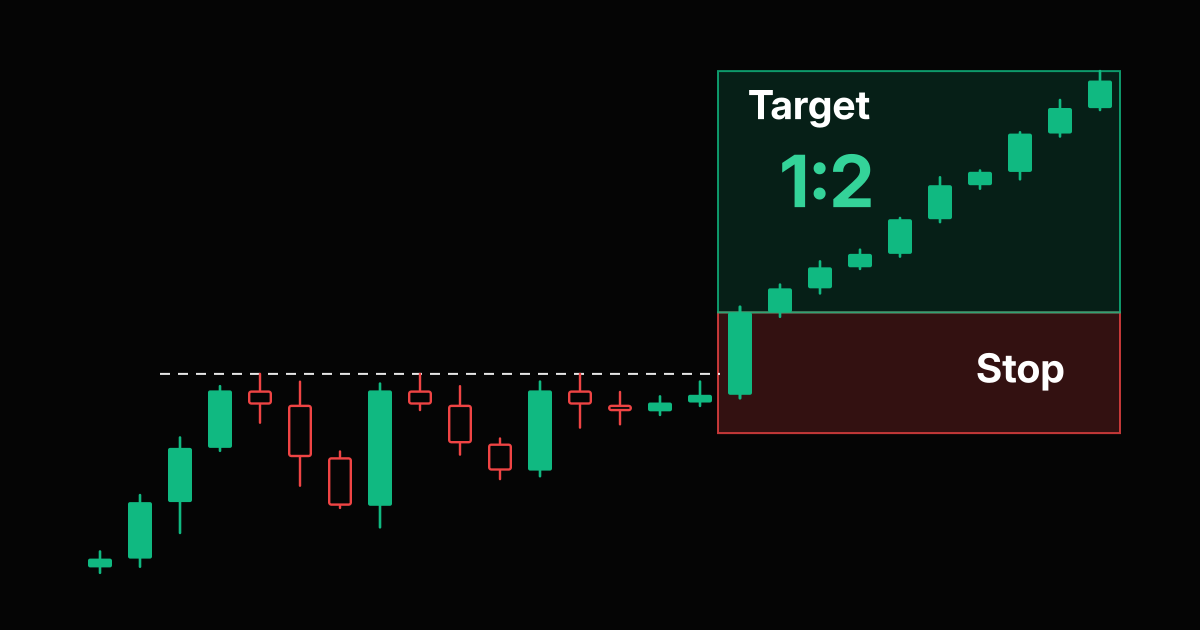
- Clean breakouts only: after a day like November 5, many charts are broken. Wait for a stock to reclaim a clear resistance line on a daily close before you buy it, as in the breakout stocks vault.
A five step check before trading MSFT and QQQ
- Open the MSFT vs QQQ correlation page and compare the one month reading with the one year value.
- Name the idea: Microsoft news, the whole Nasdaq 100, or AI and chips.
- If both trades are long tech, give them one risk budget and split it.
- Do not count on a short QQQ hedge to protect a long MSFT position at a correlation near 0.5.
- Size each position from its own stop, in shares for stocks and in lots for NAS100.
Before you size, check the payoff with the risk reward calculator and see how the indexes compare in the US30 vs NAS100 guide.
Frequently Asked Questions
Is MSFT correlated with QQQ?
Yes, positively but only moderately. On daily closes to November 6, 2026, the correlation of daily returns was 0.66 over one month, 0.53 over three months, 0.32 over six months, 0.36 over one year and 0.52 over two years. MSFT moved in the same direction as QQQ on 158 of the last 252 trading days.
What is the beta of Microsoft to QQQ?
About 0.64 over the three months to November 6, 2026, 0.57 over one year and 0.68 over two years. On average MSFT moved a bit more than half as much as QQQ for each 1% move in the fund, even though MSFT is more volatile on its own (1.68% a day against 1.37% over three months).
How did Microsoft stock do in the November 5, 2026 selloff?
MSFT closed down 3.58% on November 5, 2026, while QQQ fell 6.49%, Nvidia 9.26% and SPY 4.41%. NBC News reported that the Nasdaq 100 dropped 6.3% on fears about the AI boom after the midterm results and mixed chip earnings, and that the big cloud providers fell less than the market.
Why did MSFT hold up better than QQQ?
The selloff was led by chip and memory stocks, which weigh heavily on QQQ, while Microsoft had just reported a quarter that beat estimates, with Azure revenue up 48% to $33.17 billion. Over the month to November 6, 2026, QQQ fell 12.24% and MSFT rose 1.53%. Past resilience does not promise the same next time.
Can I hedge a long MSFT position by shorting QQQ?
Only a little. At the three month correlation of 0.53, a long MSFT and a short QQQ that each risk 1% still swing like about 0.97% of risk, close to one unhedged position. The hedge works on market wide selloffs but not when Microsoft moves on its own news. If you hedge, size QQQ by beta: about $6,400 of QQQ per $10,000 of MSFT at a beta of 0.64.
How many MSFT shares can I buy risking 1%?
Divide your dollar risk by the stop distance per share. On a $10,000 account, 1% is $100. With a $16 stop below a $530.61 entry, that is 6 shares ($96 at risk). For NAS100 CFDs at $1 per point per 1.0 lot, a 200 point stop with $100 at risk is 0.5 lot.
Risk Disclaimer: Trading stocks, options, futures, forex, commodities, and cryptocurrencies involves substantial risk of loss and is not suitable for every investor. Past performance does not guarantee future results. This article is for educational purposes only and does not constitute financial advice. You should carefully consider your financial situation and risk tolerance before trading. Never trade with money you cannot afford to lose. Correlation readings change over time and are calculated from daily closing prices, which can differ from your broker's prices.