bull flag
Bull Flag Pattern: 7 Rules, the Measure Rule and When It Fails
A bull flag is a short, orderly pullback after a sharp rally. The rally is the flagpole. The pullback is the flag: a small channel between two parallel lines that tilts down or sideways. The pattern is confirmed when price closes above the upper line, which signals that the earlier advance is resuming.
Most traders can spot a bull flag. Fewer know the rules that separate a good one from a lazy pullback, how the measured move really works, or what the published statistics say about how often it fails. This guide gives you seven rules, the measure rule with a real worked example, a position sizing example, and a clear list of what to do when the flag fails.
The three parts of a bull flag
The StockCharts ChartSchool guide to flags and pennants describes flags as short term continuation patterns that mark a small consolidation before the previous move resumes, usually after a sharp advance on heavy volume. Every bull flag has the same three parts:
- The flagpole. A fast, near vertical advance, often through a resistance level. It is the evidence that buyers were in control.
- The flag. A small rectangle that slopes against the prior trend. After a rally, that means flat or drifting lower, between two parallel lines.
- The breakout. A close above the upper line of the flag, ideally with volume expanding again.
The Wikipedia entry on flag and pennant patterns adds the same idea in plain terms: the market is taking a breather after a big move before continuing its primary trend. If the pause has converging lines instead of parallel ones, it is a pennant, which we compare in Bull Flag vs Bull Pennant vs Rising Wedge.
The 7 rules of a tradeable bull flag
These rules come from the identification guidelines on Thomas Bulkowski's flag pattern page and from StockCharts. If a setup breaks more than one of them, skip it.
- No pole, no flag. Bulkowski is blunt: if you do not have a straight line, quick price run, you do not have a flag. The best performing flags have a long, near vertical pole.
- Keep it short. Bulkowski says flags last less than 3 weeks on a daily chart. Anything longer is a rectangle or a channel. StockCharts allows up to 12 weeks for flags and pennants, ideally one to four.
- Parallel lines. Price should stay between two parallel or near parallel trend lines. If the lines converge, you are looking at a pennant.
- Tilt against the trend. The best performance comes when the inbound trend is up and the flag tilts down, according to Bulkowski.
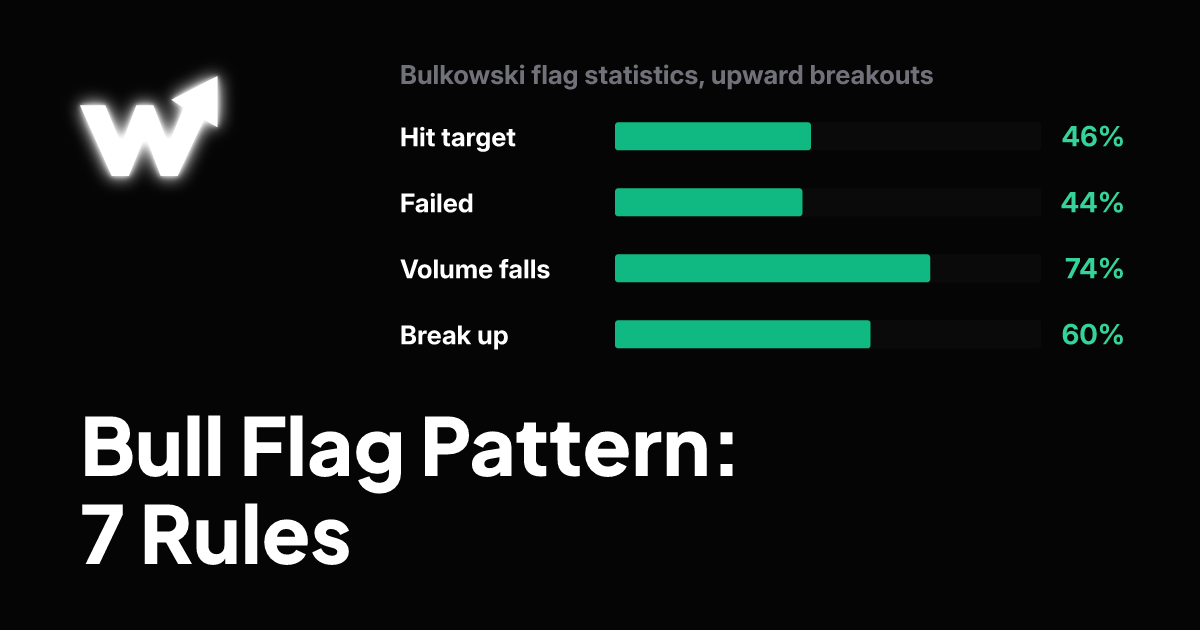
- Volume fades inside the flag. Volume should be heavy on the pole, shrink during the flag and expand on the breakout. Bulkowski found a downward volume trend 74% of the time in flags with upward breakouts.
- Tight beats loose. A tight flag performs better than a loose one. A loose flag meanders, pokes outside the trend lines, has white space or looks jagged.
- Trade the close, not the wick. Enter only after a candle closes above the upper line. A wick that pokes through and falls back is not a breakout.
Bulkowski adds two context rules. A flag above a flat base tends to produce a larger move, and the best performers have a breakout within a third of the yearly low. Treat these as bonuses, not requirements.
What the statistics say about bull flags
The numbers below are Bulkowski's bull market results for flags, based on what he calls hundreds of perfect trades. His page was last updated on 8/27/2020, and he measures flags on the short term price swing, not the full move to the ultimate high. Treat them as context from one dataset, not a promise for your market or timeframe.
| Measure | Upward breakouts | Downward breakouts |
|---|---|---|
| Break even failure rate | 44% | 45% |
| Average rise or decline | 9% | 8% |
| Meeting the price target | 46% | 46% |
| Volume trend down inside the flag | 74% | 77% |
Bulkowski also reports that flags break upward 60% of the time. Two things follow. First, a 44% break even failure rate is high, so the stop is not optional. Second, less than half of upward flags reach the full measured target, so plan around a smaller first target.
The measure rule: a real worked example
The classic bull flag target is a measured move. Measure the flagpole, then add that length to the breakout point. StockCharts shows it on a real chart of HPQ:
- HPQ broke above resistance at $28 and rallied to $38 in four weeks, so the pole measured 10 points.
- The flag drifted down inside two parallel lines for 23 days and broke out at $36.
- Adding the 10 point pole to the $36 breakout gave a target of $46.
A second Bulkowski idea is the half staff flag. Sometimes the flag appears midway in the move, so the second leg equals the first. In that case the pole is the move that came before the flag, and the target is the same distance again above the flag.
Because only 46% of upward flags in his data reached the target, many traders scale out. Take part of the position at 1:1 or 1:2 risk and trail the rest. You can test different targets in the risk reward calculator.
How to trade a bull flag: entry, stop, target, size
- Entry: the close of the first candle above the upper line of the flag.
- Stop: just under the lowest low of the flag. If price falls back through the whole pause, the continuation idea has failed.
- Target: a first target at a fixed multiple of your risk, and the measured move as the full target.
- Size: divide the money you are willing to lose by the stop distance.
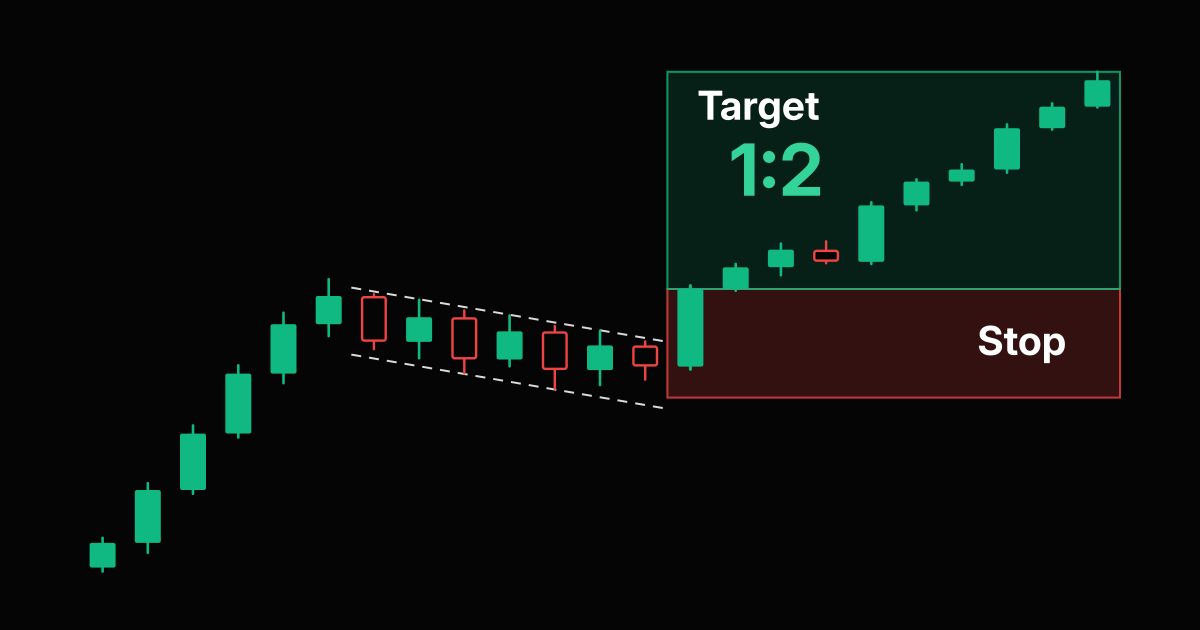
An example on US30, where 1.0 lot is $1 per point. Your account is $10,000 and you risk 1%, so you can lose $100. The flag breaks out and your stop sits 50 points below your entry. Divide $100 by 50 points and you get 2.0 lots. A 1:2 target is 100 points above entry, worth about $200 at that size. NAS100 and SPX500 use the same $1 per point per 1.0 lot. These are illustration numbers for the arithmetic, not a forecast.
Do the math before the breakout, not during it, with the position size calculator or the US30 lots calculator. The full process is in How to Calculate Risk Reward Ratio Before Entering a Trade.
When a bull flag fails
With a 44% break even failure rate in Bulkowski's data, failure is part of the pattern. These are the warning signs and what to do about each one.
- The flag drags on. Past roughly three weeks on a daily chart, Bulkowski would call it a rectangle or channel. Reclassify it and use different rules.
- Volume rises inside the flag. Heavy selling during the pause means the sellers are not tired. The setup is weaker.
- Price breaks the flag low. Your stop is there. Take the small loss, because the pattern has failed by definition.
- The breakout has no follow through. A close above the line that reverses the next day is a failed breakout. Do not move the stop to hope it back.
- The pole was not steep. Without a quick run, there was nothing to continue.
Flags can also fail around news. If a big report is due inside the flag, wait for the release before you trust the setup. See The Most Reliable Candlestick Patterns for how to read the breakout candle itself.
Bull flag vs bear flag
A bear flag is the mirror image. A sharp decline forms the pole, price then drifts sideways or up between two parallel lines, and the pattern confirms with a close below the lower line. The same rules apply in reverse: short flag, falling volume inside it, a tight channel and a stop above the flag high. Bulkowski's table above shows similar statistics for downward breakouts, with a 45% break even failure rate.
Finding bull flags without hunting every chart
Flags are short, so you can miss them while flipping through charts. A chart pattern scanner like SIWAI does the first pass across stocks, crypto, forex, indices and commodities, so you spend your time on the seven rules above. The workflow is covered in How to Scan Stocks for Chart Patterns Without Hours of Chart Hunting, and a different pattern with the opposite logic is explained in Head and Shoulders Pattern: Bullish or Bearish?
Frequently asked questions
What is a bull flag pattern?
A bull flag is a continuation pattern: a sharp rally (the flagpole) followed by a short pullback inside two parallel lines that tilt down or sideways (the flag). It is confirmed when price closes above the upper line, which signals that the advance is resuming.
How long should a bull flag last?
Short. Thomas Bulkowski says flags last less than 3 weeks on a daily chart, and longer patterns are rectangles or channels. StockCharts allows 1 to 12 weeks for flags and pennants, ideally 1 to 4 weeks.
How reliable is a bull flag?
In Bulkowski's bull market data, flags with upward breakouts had a 44% break even failure rate, and 46% met the price target. Flags break upward 60% of the time. That makes a stop essential and a full target less than a coin flip.
How do you calculate the target of a bull flag?
Measure the flagpole and add that distance to the breakout point. In the StockCharts HPQ example, the pole ran from $28 to $38 (10 points), the breakout was at $36 and the target was $46.
Should volume rise or fall in a bull flag?
Ideally volume is heavy on the pole, fades inside the flag and expands on the breakout. Bulkowski found a downward volume trend in 74% of flags with upward breakouts.
Where do you put the stop on a bull flag?
Just under the lowest low of the flag. If price falls back below the whole pause, the setup has failed. Divide the amount you are willing to risk by that stop distance to get your position size. On US30, NAS100 and SPX500, 1.0 lot is $1 per point.
Risk Disclaimer: Trading stocks, options, futures, forex, and cryptocurrencies involves substantial risk of loss and is not suitable for every investor. Past performance does not guarantee future results. This article is for educational purposes only and does not constitute financial advice. You should carefully consider your financial situation and risk tolerance before trading. Never trade with money you cannot afford to lose.