EURUSD
EURUSD vs USDCAD Correlation: Live Readings, Risk Stacking and Lot Sizing
EURUSD and USDCAD usually move in opposite directions because the US dollar sits on opposite sides of the two pairs. On ECB reference rates to November 5, 2026, the correlation of their daily returns was -0.60 over one year, -0.58 over six months and -0.54 over three months. Over the last month it softened to -0.27 as the Canadian dollar strengthened while the euro barely moved.
This Value guide turns those readings into decisions: when a long in one pair really hedges the other, how much risk you stack when both trades are the same dollar idea, and how to size each leg from one budget. The figures use the same data and windows as the free SIWAI EURUSD vs USDCAD correlation page, so you can check the current reading before you trade.
Why EURUSD and USDCAD usually oppose each other
EURUSD is the price of one euro in US dollars. USDCAD is the price of one US dollar in Canadian dollars. A stronger dollar pushes EURUSD down and USDCAD up in the same session. That shared dollar leg is why the correlation coefficient between the two is usually negative.
Each pair also carries its own currency. ECB decisions and euro area data move the euro alone. Bank of Canada decisions, Canadian jobs and oil linked flows move the loonie alone (see the BoC policy interest rate page). On a Canada day, USDCAD can swing while EURUSD barely moves, and the short window reading softens.
A coefficient of +1 means the daily moves always line up, 0 means no linear link and -1 means they always move in opposite directions. Over the last three months, EURUSD and USDCAD closed in opposite directions on 48 of 66 ECB fixing days (73%), and in the same direction on only 16 of 66 (24%).
EURUSD vs USDCAD correlation by time frame
The inputs are ECB euro reference rates (see the ECB reference rates page) loaded through the Frankfurter exchange rate API, converted to dollar pairs and compared as daily percentage returns. All windows end on November 5, 2026.
| Window | Start | Correlation | Opposite days |
|---|---|---|---|
| 1 month | Oct 5, 2026 | -0.27 | 15 of 23 (65%) |
| 3 months | Aug 5, 2026 | -0.54 | 48 of 66 (73%) |
| 6 months | May 6, 2026 | -0.58 | 90 of 131 (69%) |
| 1 year | Nov 4, 2025 | -0.60 | 185 of 256 (72%) |
| 2 years | Oct 28, 2024 | -0.66 | 373 of 516 (72%) |
How to read it in practice:
- Around -0.5 to -0.7: a long EURUSD and a long USDCAD partly cancel on the dollar. That is the three month to two year picture.
- Near -0.3 or weaker: Canada specific moves dominate, so the hedge is unreliable. That is the October to early November 2026 reading.
- Check the live number on the EURUSD vs USDCAD tool page before you treat either pair as a hedge for the other.
Where each pair sits against the other majors
Context for both legs on the same three month and one year windows. EURUSD still tracks GBPUSD most closely. USDCAD still tracks USDCHF most closely among the dollar base pairs.
EURUSD vs majors
| EURUSD vs | 1 month | 3 months | 6 months | 1 year |
|---|---|---|---|---|
| GBPUSD | 0.85 | 0.84 | 0.85 | 0.85 |
| NZDUSD | 0.44 | 0.61 | 0.66 | 0.72 |
| AUDUSD | 0.37 | 0.52 | 0.62 | 0.68 |
| EURCAD | 0.83 | 0.52 | 0.62 | 0.65 |
| USDCAD | -0.27 | -0.54 | -0.58 | -0.60 |
| USDJPY | -0.20 | -0.39 | -0.40 | -0.54 |
| USDCHF | -0.71 | -0.60 | -0.74 | -0.83 |
USDCAD vs majors
| USDCAD vs | 1 month | 3 months | 6 months | 1 year |
|---|---|---|---|---|
| USDCHF | 0.44 | 0.63 | 0.62 | 0.61 |
| USDJPY | 0.30 | 0.46 | 0.39 | 0.36 |
| EURCAD | 0.32 | 0.44 | 0.28 | 0.22 |
| AUDUSD | -0.35 | -0.50 | -0.50 | -0.57 |
| EURUSD | -0.27 | -0.54 | -0.58 | -0.60 |
| GBPUSD | -0.42 | -0.57 | -0.59 | -0.61 |
| NZDUSD | -0.53 | -0.68 | -0.62 | -0.64 |
For more on the Canadian dollar side, see the USDCAD and oil correlation guide and the USDCHF correlation guide. For euro side sizing, see the EURUSD lot size guide.
Why the link softened in late October 2026
From October 5 to November 5, 2026, EURUSD rose only 0.18% (1.1204 to 1.1224) while USDCAD fell 2.02% (1.4253 to 1.3966). The Canadian dollar did the work. Rolling three month correlation, which had sat between about -0.58 and -0.68 from May through September, eased to -0.54 by November 5, and the one month reading dropped to -0.27.
| Change | 1 month | 3 months | 6 months | 1 year |
|---|---|---|---|---|
| EURUSD | +0.18% | -2.86% | -4.57% | -2.32% |
| USDCAD | -2.02% | -0.58% | +2.67% | -0.80% |
| EURCAD | -1.84% | -3.42% | -2.03% | -3.11% |
Policy sat behind part of that CAD move. On October 28, 2026 the Bank of Canada raised its overnight rate target by 25 basis points to 2.5% (see the BoC October 28 press release), while the Federal Reserve held the federal funds target range at 3.75% to 4% the same day (see the FOMC statement). A Canada led move is exactly when you should not treat a long EURUSD as a clean hedge for a long USDCAD.
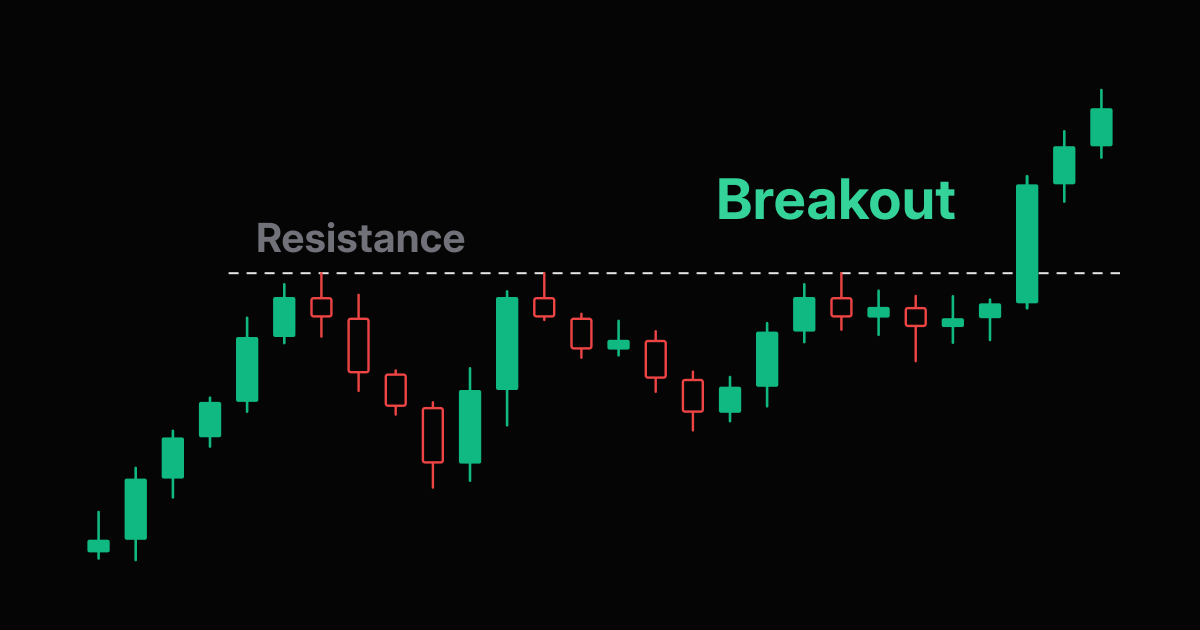
EURUSD vs USDCAD side by side
| Measure | EURUSD | USDCAD | EURCAD |
|---|---|---|---|
| Rate on Nov 5, 2026 | 1.1224 | 1.3966 | 1.5675 |
| Average daily move, 3 months | 26.8 pips | 29.0 pips | 32.7 pips |
| Median daily move, 3 months | 24.0 pips | 23.2 pips | 22.0 pips |
| Average daily move, 1 year | 29.5 pips | 27.8 pips | 35.0 pips |
| Median daily move, 1 year | 23.0 pips | 21.7 pips | 26.0 pips |
| Daily volatility, 3 months | 0.30% | 0.29% | 0.28% |
| Daily volatility, 1 year | 0.35% | 0.27% | 0.28% |
| Pip value per 1.0 lot | $10 | about $7.16 | about $7.16 |
EURUSD pays $10 per pip on 1.0 lot because the quote currency is the dollar. USDCAD pays 10 Canadian dollars per pip on 1.0 lot, about $7.16 at 1.3966. The two pairs move a similar number of pips a day, so a USDCAD stop in pips often needs a slightly larger lot to risk the same dollars.
How much risk you stack trading both
Two positions that each risk 1% swing together like one bigger position when they are correlated. The combined swing is the square root of (2 + 2 times the correlation of the two position returns), in units of one position's risk. Direction matters a lot because the raw EURUSD and USDCAD correlation is negative.
| Positions | Correlation used | Behaves like |
|---|---|---|
| Long EURUSD and long USDCAD (partial dollar hedge) | -0.60 (1 year) | about 0.89% of risk |
| Long EURUSD and long USDCAD (partial dollar hedge) | -0.54 (3 months) | about 0.96% of risk |
| Long EURUSD and short USDCAD (both short the dollar) | -0.54 (3 months) | about 1.75% of risk |
| Long EURUSD and short USDCAD (both short the dollar) | -0.27 (1 month) | about 1.59% of risk |
Buying both looks like a hedge on the long run numbers, close to one 1% risk unit. Selling the dollar on both charts (long EURUSD and short USDCAD) is mostly one dollar trade, and at the three month reading it swings like about 1.75%. Use the shortest window that covers your holding period. The guide to using correlation in forex covers the general rule.
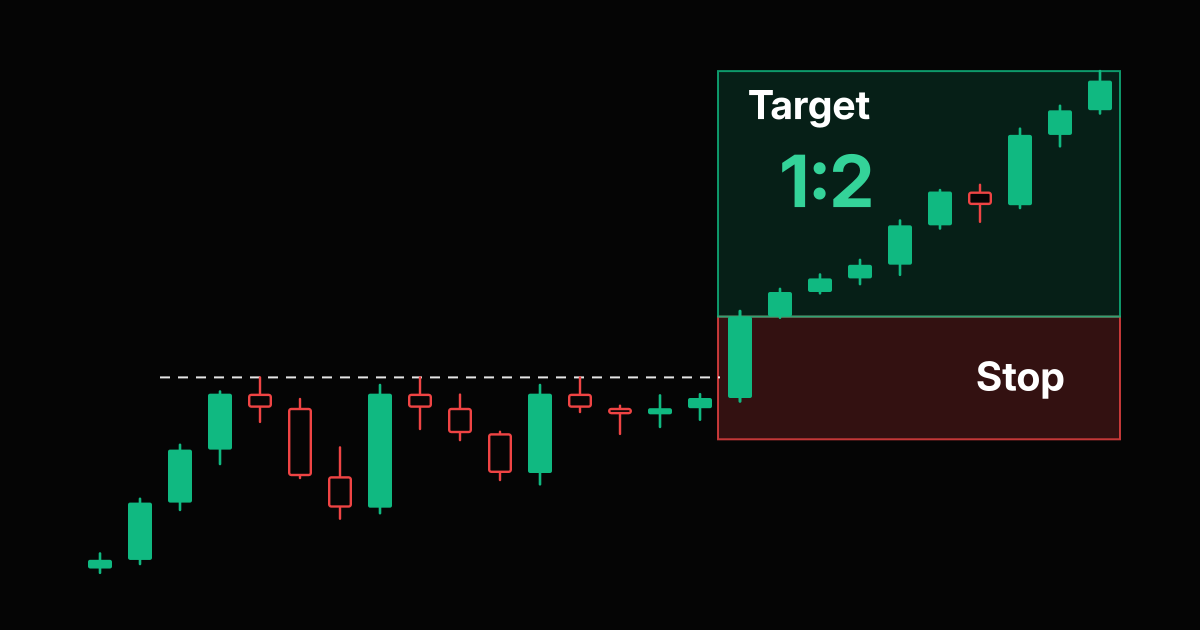
Lot sizing EURUSD and USDCAD
Lots = risk in dollars divided by (stop in pips times pip value). The table uses 1% risk, a 25 pip stop on both pairs (near each three month median daily move), $10 per pip on EURUSD and about $7.16 per pip on USDCAD at 1.3966, rounded down to 0.01 lot.
| Account | 1% risk | EURUSD, 25 pip stop | USDCAD, 25 pip stop |
|---|---|---|---|
| $1,000 | $10 | 0.04 lot ($10) | 0.05 lot (about $9) |
| $5,000 | $50 | 0.20 lot ($50) | 0.27 lot (about $48) |
| $10,000 | $100 | 0.40 lot ($100) | 0.55 lot (about $98) |
| $25,000 | $250 | 1.00 lot ($250) | 1.39 lots (about $249) |
If both trades are the same dollar idea on a $10,000 account, splitting one $100 budget gives 0.20 lot on EURUSD ($50) and 0.27 lot on USDCAD (about $48). Check your own numbers with the EURUSD lot size calculator, the USDCAD lot size calculator or the position size calculator.
A five step check before trading both
- Open the EURUSD vs USDCAD correlation page and compare the 1M and 3M values with 1Y.
- Name the leg: dollar, euro or Canadian dollar. A BoC day is not an ECB day.
- Check EURCAD: if it moves strongly, the move is about the euro versus the loonie, not only the dollar.
- If both trades sell the dollar, give them one risk budget and split it.
- Size each leg from its own stop: $10 per pip on EURUSD, about $7.16 per pip on USDCAD at 1.3966.
Before you size, check the payoff with the risk reward calculator.
Frequently Asked Questions
Are EURUSD and USDCAD correlated?
Usually negatively. On ECB reference rates to November 5, 2026, the correlation of daily returns was -0.54 over three months, -0.58 over six months, -0.60 over one year and -0.66 over two years. Over one month it softened to -0.27.
Why are EURUSD and USDCAD negatively correlated?
Because the US dollar sits on opposite sides of the two pairs. A stronger dollar pushes EURUSD down and USDCAD up. Each pair also has its own currency leg, so Bank of Canada or ECB days can weaken the short window reading.
Is a long EURUSD a hedge for a long USDCAD?
Partly, when the dollar is driving both. At the one year correlation of -0.60, two 1% risk longs swing like about 0.89% of risk. After the late October 2026 Canadian dollar rally the one month reading was only -0.27, so the hedge was much weaker.
What is the pip value of USDCAD versus EURUSD?
EURUSD pays $10 per pip on 1.0 lot. USDCAD pays 10 Canadian dollars per pip on 1.0 lot, about $7.16 at the November 5, 2026 ECB derived rate of 1.3966.
Can I trade EURUSD and USDCAD at the same time?
Yes, but name the idea first. Long EURUSD and short USDCAD are both dollar shorts, and at the three month correlation of -0.54 two trades risking 1% each swing like about 1.75% of risk. Give same direction dollar trades one budget and split it.
Why did the EURUSD and USDCAD correlation weaken in October 2026?
From October 5 to November 5, 2026, EURUSD rose only 0.18% while USDCAD fell 2.02%. On October 28 the Bank of Canada raised its overnight rate target by 25 basis points to 2.5%, while the Fed held, so the Canadian dollar led the move.
Risk Disclaimer: Trading stocks, options, futures, forex, commodities, and cryptocurrencies involves substantial risk of loss and is not suitable for every investor. Past performance does not guarantee future results. This article is for educational purposes only and does not constitute financial advice. You should carefully consider your financial situation and risk tolerance before trading. Never trade with money you cannot afford to lose. Correlation readings change over time and are calculated from daily ECB reference rates, which can differ from your broker's prices.