AUDUSD
AUDUSD vs USDCAD: Correlation, Volatility and Lot Sizing for the Aussie and Loonie
AUDUSD and USDCAD usually move in opposite directions. Both are commodity currencies priced against the US dollar, but the dollar sits on opposite sides of the two quotes. On ECB reference rates to November 6, 2026, the correlation of their daily returns was -0.57 over three months, -0.58 over one year and -0.66 over two years. They closed in opposite directions on 47 of the last 66 fixing days.
The two pairs are not twins, though. AUDUSD swung about 1.5 times as much as USDCAD in percentage terms over three months, USDCAD still moves more pips per day, and each pip is worth a different amount. This comparison puts the Aussie and the loonie side by side: correlation by time frame, volatility, what happened in the November 6 Aussie selloff, how much risk you stack trading both and how to size each leg. You can check the current reading on the free SIWAI AUDUSD vs USDCAD correlation page.
Aussie vs loonie: what moves each pair
AUDUSD is the price of one Australian dollar in US dollars. USDCAD is the price of one US dollar in Canadian dollars. A broad dollar rally pushes AUDUSD down and USDCAD up at the same time, which is why the correlation coefficient between them is negative most of the time.
The other leg is where they differ. The Australian dollar trades as a risk sensitive currency tied to Asian demand and global equities, and it reacts to Reserve Bank of Australia decisions. The Canadian dollar leans on oil and on the Bank of Canada, and Canada sells most of its exports to the United States. So the two pairs share the dollar, but not the rest of the story.
Policy rates show how far apart the two sides sit. The RBA raised its cash rate target by 25 basis points to 4.85% on November 3, 2026 (see the RBA November 3 statement), while the Bank of Canada raised its overnight rate target to 2.5% on October 28, 2026 (see the BoC October 28 press release). Rate gaps matter for carry, but as the next sections show, the daily correlation is still driven mostly by the dollar and by risk appetite.
AUDUSD vs USDCAD correlation by time frame
The inputs are ECB euro reference rates (see the ECB reference rates page) loaded through the Frankfurter exchange rate API, converted to dollar pairs and compared as daily percentage returns. All windows end on November 6, 2026.
| Window | Start | Correlation | Opposite days |
|---|---|---|---|
| 1 month | Oct 6, 2026 | -0.62 | 16 of 23 (70%) |
| 3 months | Aug 6, 2026 | -0.57 | 47 of 66 (71%) |
| 6 months | May 7, 2026 | -0.54 | 88 of 131 (67%) |
| 1 year | Nov 5, 2025 | -0.58 | 182 of 256 (71%) |
| 2 years | Nov 5, 2024 | -0.66 | 370 of 511 (72%) |
How to read it in practice:
- Around -0.55 to -0.65: a moderate negative link. A long AUDUSD and a long USDCAD partly cancel on the dollar, but far from fully.
- Stronger in the past: the rolling three month reading sat between -0.78 and -0.84 from late July to late October 2025, then drifted to about -0.50 by October 21, 2026 before stepping back to -0.57.
- One day can move the short window: without November 6, the one month reading was -0.36. That single Aussie selloff took it to -0.62.
The tool page refreshes on its own schedule, so its reading can differ slightly from these figures. Use it as the current number before you trade.
AUDUSD vs USDCAD side by side
| Measure | AUDUSD | USDCAD | AUDCAD |
|---|---|---|---|
| Rate on Nov 6, 2026 | 0.6871 | 1.4066 | 0.9665 |
| Daily volatility, 3 months | 0.45% | 0.30% | 0.37% |
| Daily volatility, 1 year | 0.50% | 0.27% | 0.40% |
| Average daily move, 3 months | 22.3 pips | 29.8 pips | 27.2 pips |
| Median daily move, 3 months | 17.8 pips | 23.0 pips | 20.5 pips |
| Average daily move, 1 year | 26.3 pips | 28.0 pips | 29.6 pips |
| Change, 1 year | +5.97% | -0.45% | +5.49% |
| Pip value per 1.0 lot | $10 | about $7.11 | about $7.11 |
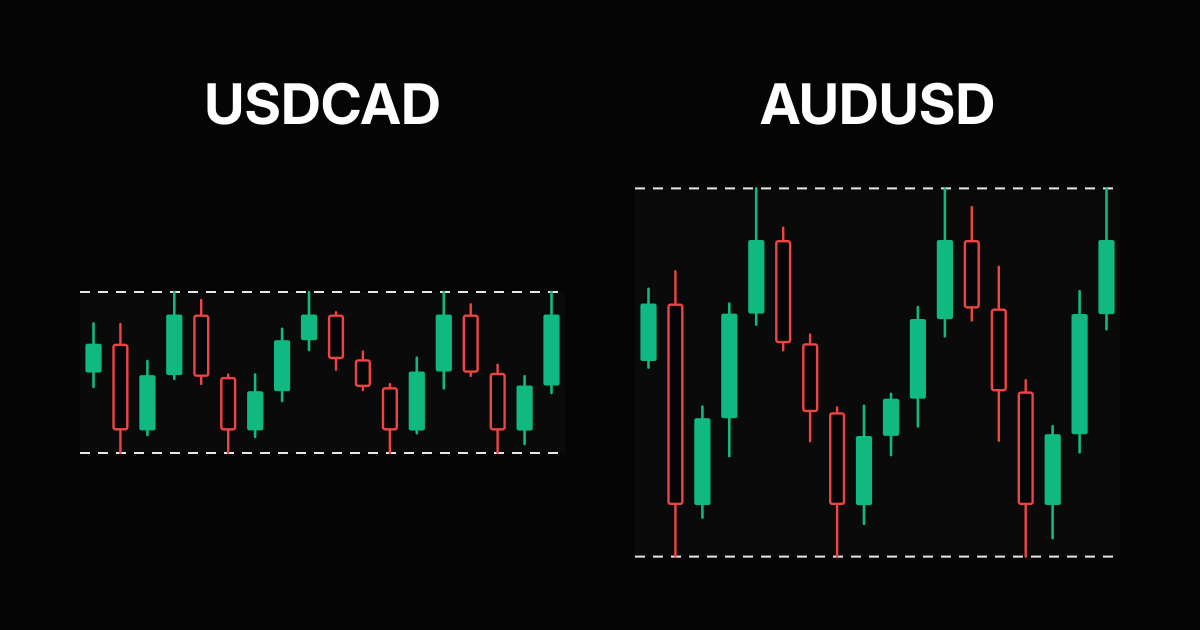
The table hides a trap. USDCAD moves more pips a day, yet AUDUSD is the more volatile pair in percentage terms. The reason is price: USDCAD trades around 1.40, so a pip is a smaller share of the price than on AUDUSD near 0.69. If you compare the pairs in pips alone, you will think USDCAD is the wild one. In risk terms, it is the Aussie.
AUDCAD settles which leg leads. Over one year AUDCAD had a 0.84 correlation with AUDUSD but only -0.04 with USDCAD. The cross mostly follows the Australian dollar, and the Canadian dollar plays the quieter role.
How each pair lines up with the other majors
Same data, same windows. AUDUSD moves most closely with NZDUSD. USDCAD lines up most closely, in reverse, with NZDUSD and GBPUSD, and directly with USDCHF.
| Pair | vs AUDUSD, 3 months | vs AUDUSD, 1 year | vs USDCAD, 3 months | vs USDCAD, 1 year |
|---|---|---|---|---|
| NZDUSD | 0.65 | 0.79 | -0.71 | -0.65 |
| GBPUSD | 0.59 | 0.73 | -0.61 | -0.61 |
| EURUSD | 0.54 | 0.68 | -0.58 | -0.61 |
| USDCHF | -0.27 | -0.57 | 0.62 | 0.60 |
| USDJPY | -0.19 | -0.30 | 0.44 | 0.35 |
| AUDCAD | 0.76 | 0.84 | 0.10 | -0.04 |
For more on each side, see the AUDUSD vs EURUSD correlation guide, the AUDUSD vs USDJPY correlation guide, the USDCAD and oil correlation guide and the EURUSD vs USDCAD correlation guide.
What the November 6 Aussie selloff showed
On November 6, 2026 the ECB derived AUDUSD rate fell 1.85%, from 0.7000 to 0.6871, the largest daily drop in this data since April 4, 2025. USDCAD rose 0.72%, from 1.3966 to 1.4066, and AUDCAD fell 1.15%. Both pairs moved the way a stronger dollar implies, but the Aussie moved about two and a half times as far.
Market reports tied the drop to a global selloff in AI related stocks, which hit risk sensitive currencies, and to a firmer US dollar after a strong US jobs report (see FXStreet on the Australian dollar, November 6). The RBA hike three days earlier did not stop the slide.
| Change | Nov 6 only | 1 month | 3 months | 6 months |
|---|---|---|---|---|
| AUDUSD | -1.85% | -1.59% | -2.43% | -5.32% |
| USDCAD | +0.72% | -1.29% | +0.49% | +3.21% |
| AUDCAD | -1.15% | -2.86% | -1.96% | -2.28% |
Look at the one month column. AUDUSD and USDCAD both fell, which is the opposite of the usual pattern: the Canadian dollar gained on the US dollar while the Aussie lost ground. Over that month a long AUDUSD and a long USDCAD both lost money, so the "hedge" did not hedge. A negative correlation describes daily moves on average. It does not promise that the two positions offset over your holding period.
How much risk you stack trading both
Two positions that each risk 1% swing together like one bigger position when they are correlated. The combined swing is the square root of (2 + 2 times the correlation of the two position returns), in units of one position's risk. Because the raw AUDUSD and USDCAD correlation is negative, direction decides whether you hedge or stack.
| Positions | Correlation used | Behaves like |
|---|---|---|
| Long AUDUSD and long USDCAD (partial dollar hedge) | -0.57 (3 months) | about 0.93% of risk |
| Long AUDUSD and long USDCAD (partial dollar hedge) | -0.66 (2 years) | about 0.82% of risk |
| Long AUDUSD and short USDCAD (both short the dollar) | -0.57 (3 months) | about 1.77% of risk |
| Long AUDUSD and short USDCAD (both short the dollar) | -0.62 (1 month) | about 1.80% of risk |
Selling the dollar on both charts is mostly one trade. At the three month reading, two 1% positions behave like a single 1.77% position. Buying both looks safer on paper, about 0.93%, but the November example shows how the cross can break the hedge when the two other currencies split. The guide to using correlation in forex explains the general rule.
Lot sizing AUDUSD and USDCAD
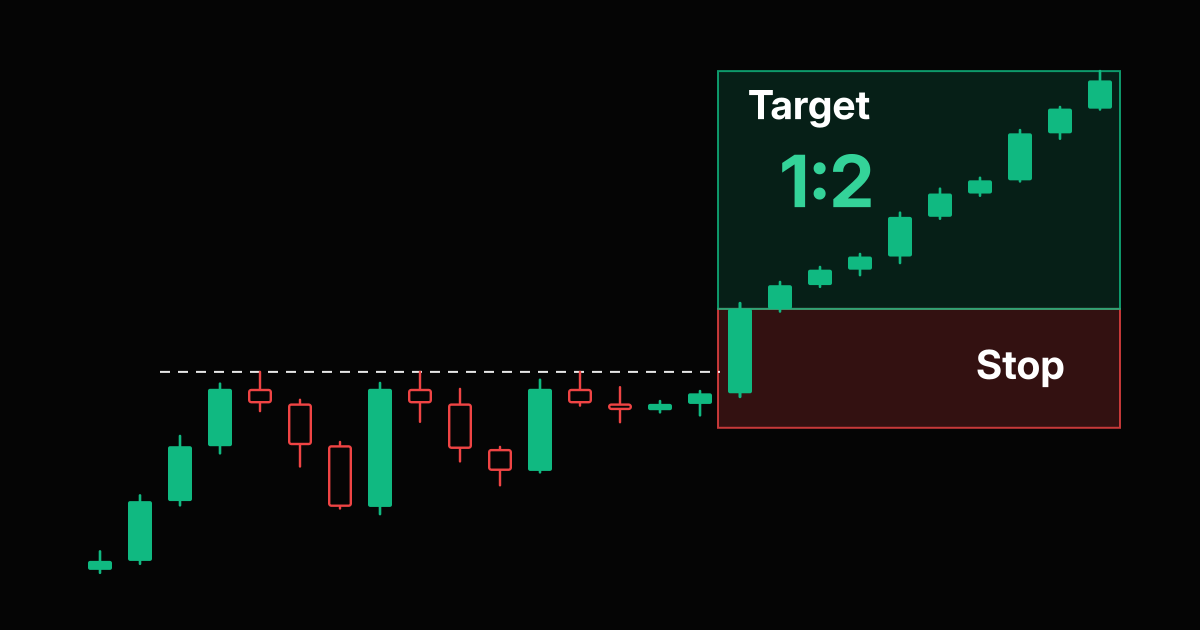
Lots = risk in dollars divided by (stop in pips times pip value). The table uses 1% risk and a 20 pip stop on both pairs (between the three month median daily moves of 17.8 and 23.0 pips), $10 per pip on AUDUSD and about $7.11 per pip on USDCAD at 1.4066, rounded down to 0.01 lot.
| Account | 1% risk | AUDUSD, 20 pip stop | USDCAD, 20 pip stop |
|---|---|---|---|
| $1,000 | $10 | 0.05 lot ($10) | 0.07 lot (about $9.95) |
| $5,000 | $50 | 0.25 lot ($50) | 0.35 lot (about $49.77) |
| $10,000 | $100 | 0.50 lot ($100) | 0.70 lot (about $99.53) |
| $25,000 | $250 | 1.25 lots ($250) | 1.75 lots (about $248.83) |
Equal pip stops are only a starting point. AUDUSD swings more in percentage terms, so a stop that fits USDCAD can be too tight on the Aussie. If both trades are the same dollar idea on a $10,000 account, split one $100 budget: 0.25 lot on AUDUSD ($50) and 0.35 lot on USDCAD (about $49.77) with the same 20 pip stops. Check your own numbers with the AUDUSD lot size calculator, the USDCAD lot size calculator or the position size calculator. The forex lot size guide walks through the formula step by step.
AUDUSD or USDCAD: which fits your setup?
- Trading risk appetite or Asia: AUDUSD reacts more to equity selloffs and Asian demand, and it carries the larger percentage swings.
- Trading oil or Canada: USDCAD is the cleaner vehicle, with smaller percentage moves and a closer link to the oil price.
- Trading the US dollar: pick one of the two, or split one budget between them. Do not take full size on both.
- Trading Australia against Canada: use AUDCAD directly instead of two dollar legs.
A five step check before trading both
- Open the AUDUSD vs USDCAD correlation page and compare the short window with the one year value.
- Name the driver: the dollar, the Aussie (risk, RBA) or the loonie (oil, BoC).
- Check AUDCAD. A big AUDCAD move means the two other currencies are splitting, and the hedge is weak.
- If both trades sell or both buy the dollar, give them one risk budget and split it.
- Size each leg from its own stop: $10 per pip on AUDUSD, about $7.11 per pip on USDCAD at 1.4066.
Before you size, check the payoff with the risk reward calculator or compare more pairs in the forex correlation matrix.
Frequently Asked Questions
Are AUDUSD and USDCAD correlated?
Yes, negatively. On ECB reference rates to November 6, 2026, the correlation of daily returns was -0.62 over one month, -0.57 over three months, -0.54 over six months, -0.58 over one year and -0.66 over two years. They closed in opposite directions on 47 of the last 66 fixing days.
Why are AUDUSD and USDCAD negatively correlated?
Because the US dollar is the quote currency in AUDUSD and the base currency in USDCAD. A stronger dollar pushes AUDUSD down and USDCAD up. The Australian and Canadian dollars have their own drivers (risk appetite and the RBA for the Aussie, oil and the BoC for the loonie), so the link is moderate rather than perfect.
Which is more volatile, AUDUSD or USDCAD?
AUDUSD in percentage terms: 0.45% daily volatility over three months against 0.30% for USDCAD, and 0.50% against 0.27% over one year. USDCAD still moves more pips a day (29.8 against 22.3 on average over three months) because it trades near 1.40, so a pip is a smaller share of its price.
What is the pip value of AUDUSD versus USDCAD?
AUDUSD pays $10 per pip on 1.0 lot because the quote currency is the US dollar. USDCAD pays 10 Canadian dollars per pip on 1.0 lot, about $7.11 at the November 6, 2026 ECB derived rate of 1.4066.
Is a long AUDUSD a hedge for a long USDCAD?
Only partly. At the three month correlation of -0.57, two 1% risk longs swing like about 0.93% of risk. But from October 6 to November 6, 2026 AUDUSD fell 1.59% and USDCAD fell 1.29%, so both longs lost money. When the Australian and Canadian dollars split, the hedge fails.
Can I trade AUDUSD and USDCAD at the same time?
Yes, but name the idea first. Long AUDUSD and short USDCAD are both US dollar shorts, and at the three month correlation of -0.57 two trades risking 1% each swing like about 1.77% of risk. Give same direction dollar trades one budget and split it, or trade AUDCAD if your view is Australia against Canada.
Risk Disclaimer: Trading stocks, options, futures, forex, commodities, and cryptocurrencies involves substantial risk of loss and is not suitable for every investor. Past performance does not guarantee future results. This article is for educational purposes only and does not constitute financial advice. You should carefully consider your financial situation and risk tolerance before trading. Never trade with money you cannot afford to lose. Correlation readings change over time and are calculated from daily ECB reference rates, which can differ from your broker's prices.