earnings season
Why Do Stocks Drop After Good Earnings? What Q3 2026 Bank Earnings Just Showed
Why do stocks drop after good earnings? Because the price already reflects what the market expected, and the reaction is decided by the gap between the result and that expectation, plus what management says about the next quarter. A beat that was already priced in, a soft outlook, or a nervous macro backdrop can all turn a strong report into a red candle.
Wall Street just ran a live test of this. In the first week of Q3 2026 earnings season, all six major US banks saw their shares fall after reporting, including the ones that beat estimates. This article walks through what happened, the five reasons behind it, and a simple chart plan for trading a stock after earnings without guessing the headline.
What happened in Q3 2026 bank earnings week
JPMorgan Chase, Wells Fargo, Goldman Sachs and Citigroup reported on Tuesday, October 13, 2026. Bank of America, Morgan Stanley, BlackRock and State Street followed on Wednesday, October 14. As CNBC summarized on October 14, all six major bank stocks fell following their third quarter reports, even as some delivered strong results.
Goldman Sachs is the clearest example. Per Reuters, it earned $17.01 per share against $13.02 expected by analysts (LSEG estimates), and its equities business posted a 72% jump in quarterly revenue to $6.44 billion. CNBC reported that the shares surrendered an early rally, finished Tuesday slightly lower, and lost another 1.5% on Wednesday.
Citigroup posted its best third quarter revenue in a decade, up 8% year over year, and raised its full year net interest income outlook. The stock still fell 5.6%, which Investing.com's bank earnings results table called its worst day since April 2025. Morgan Stanley beat on both earnings and revenue and still ended Wednesday nearly 3% lower.
The backdrop did not help. On Wednesday the September CPI report showed prices up 3.7% from a year earlier against 3.6% expected, and the S&P 500 fell 1.11% to 7,718.94 while the Nasdaq Composite dropped 1.88% to 26,692.87, according to CNBC's October 14 market coverage. Details of the inflation print are in CNBC's September CPI report.
| Bank | EPS vs estimate | Revenue vs estimate | Stock reaction reported |
|---|---|---|---|
| Goldman Sachs | $17.01 vs $13.09 | $18.68B vs $16.86B | Gave up an early rally, slightly lower Tuesday, then down 1.5% Wednesday |
| Citigroup | $2.85 vs $2.65 | $23.85B vs $23.72B | Down 5.6% after the report |
| Morgan Stanley | $3.03 vs $2.94 | $20.34B vs $19.96B | Ended Wednesday nearly 3% lower |
| Wells Fargo | $1.87 vs $1.84 | $21.87B vs $22.31B | Fell after the report, rose slightly Wednesday |
| JPMorgan Chase | $5.75 vs $5.93 | $50.17B vs $51.23B | Recovered much of its early losses, up nearly 1% Wednesday |
| Bank of America | Missed | $30.0B vs $30.58B | Fell roughly 5% after the report |
Estimates and results from the Investing.com results table (October 14, 2026); estimate sources differ slightly, which is why Reuters cites $13.02 for Goldman. Stock reactions from CNBC (October 14, 2026). Bank of America also faced a $1.2 billion regulatory penalty that week.
Why do stocks drop after good earnings? Five reasons
- The beat was already priced in. A stock that ran up into the report has buyers who bought the expectation. When the good news lands, some of them sell. CNBC's Jim Cramer said of Citi: "My suspicion is that Citi's stock was punished for its recent outperformance."
- The bar was higher than the published consensus. Traders compare results to their own expectations, not only to the analyst average. A beat that is smaller than what the market quietly hoped for can trade like a miss.
- The outlook matters more than the quarter. The price reflects future earnings. Comments on the call about the next quarter, margins or deal activity often move the stock more than the headline numbers. JPMorgan was the mirror image last week: it missed on both lines, but CNBC noted management offered better than expected net interest income forecasts for the fourth quarter and 2027, and the stock recovered much of its losses.
- Macro overrides the company. Cramer framed the week this way: "this is what happens when investors are worried about the future, and it's hard not to worry with persistent inflation, rising interest rates, and newly wobbly capital markets." A hot CPI day and a falling index can drag down a stock with a perfect report.
- The quality of the beat. Markets look inside the number. Goldman's beat was led by trading and advisory, while its fixed income, currency and commodities revenue came in lower, per Reuters. Investors may pay less for a beat driven by a volatile line than for steady, repeatable growth.
None of this means the first reaction is final. Academic work on post earnings announcement drift, first documented by Ball and Brown in 1968, found that prices tend to keep drifting in the direction of an earnings surprise for weeks after the report. The same summary notes that the effect has weakened over time, so treat it as context rather than a trading signal. The practical takeaway: let price show you which way the market settled, then trade the level, not the headline.
How to trade a stock after earnings without guessing the reaction
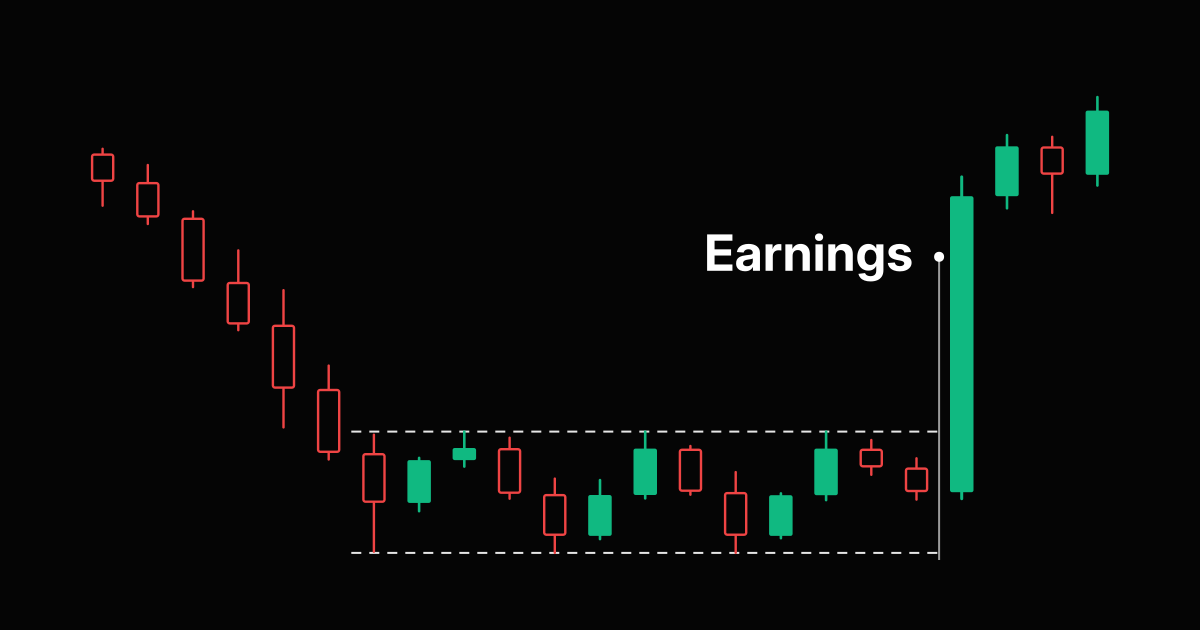
You do not need to predict whether a report will beat. You need a structure that tells you when the market has made up its mind. The cleanest one is a range that forms after the report, followed by a decisive close outside it.
- Skip the first reaction. The opening move after a report is often reversed, as Goldman showed when it gave back an early rally on Tuesday.
- Mark the reaction range. Use the high and low of the report day, or of the first few sessions after it. That box is where buyers and sellers are still arguing.
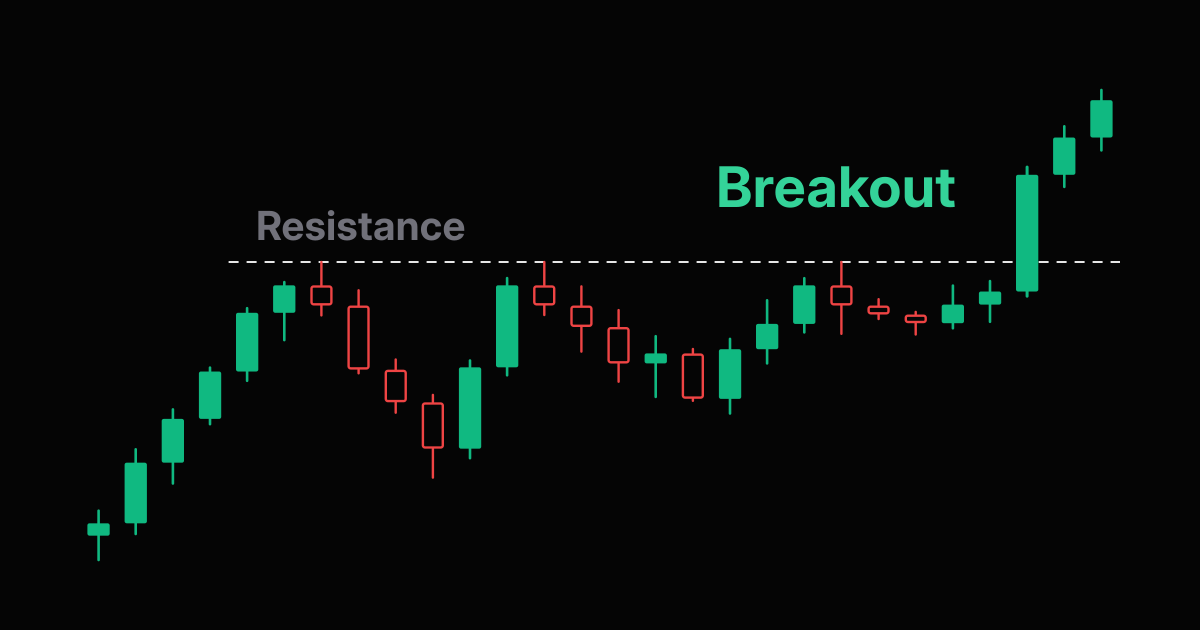
- Wait for a clean close through resistance. A daily close above a level that has rejected price more than once is the signal. A wick through it is not.
- If the chart is messy, pass. Overlapping candles with no clear ceiling are not a setup, no matter how good the report was.
Often the better trade comes days or weeks later. After the first reaction fades, the stock builds a base under a flat resistance line, tests it a few times with higher lows, and then breaks out. That is the kind of breakout SIWAI scans for every day across stocks, crypto, forex, indices and commodities. For real examples and how each one played out, see every breakout SIWAI caught, and for the scanning workflow, see how to scan stocks for chart patterns.
Stop, target and position size for a post earnings breakout
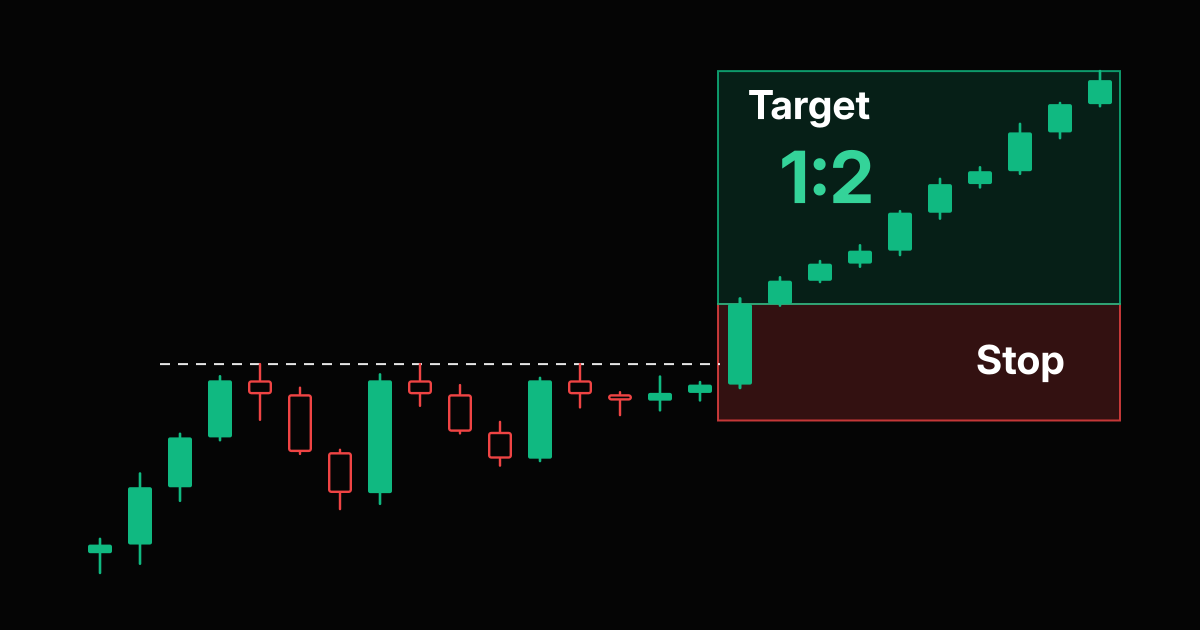
Earnings move stocks fast, so the stop decides the size, not the other way around. A simple plan for a long breakout:
- Entry: the close of the candle that breaks the resistance line.
- Stop: just under the last higher low inside the base. If price gets back there, the breakout failed.
- Target: at least twice the risk (1:2). Check it with the risk reward calculator and read how to calculate risk reward before entering a trade.
- Size: pick your risk per trade first, then divide by the stop distance.
Worked example with round numbers: a $10,000 account risking 1% has $100 at risk. If the stop is $4 below the entry on a stock, that is $100 divided by $4, or 25 shares. The position size calculator does this for any account, and there are per symbol tools such as the JPM lots calculator.
If you trade the index instead of single names during earnings season, SIWAI conventions use $1 per point per 1.0 lot on US30, NAS100 and SPX500. The same $100 risk with a 200 point stop on NAS100 is $100 divided by $200 per lot, or 0.5 lot. Run it in the NAS100 lots calculator, and see US30 vs NAS100 for how the two indices differ.
Earnings to watch this week, October 19 to 23
The bank reports were only the opening act. Per the Earnings Whispers calendar for the week of October 19, these confirmed dates are worth marking:
- Netflix, Tuesday October 20, after the close. The Netflix investor relations notice says results post at about 1:01 PM Pacific Time, with a live video interview at 1:45 PM PT. Size it with the NFLX lots calculator.
- Capital One and United Airlines, Tuesday October 20, after the close. A follow up test for lender stocks after last week's bank reaction, plus an airline report in a month of high fuel prices.
- Tesla, Wednesday October 21, after the close. Tesla's Q3 2026 deliveries release filed with the SEC says the Q&A webcast starts at 4:30 PM Central Time (5:30 PM Eastern). See the TSLA lots calculator.
- American Express, Friday October 23, before the open. Another consumer facing lender after a hot inflation month.
The Federal Reserve meets on October 27 to 28, listed on the Fed FOMC calendar, so rate worries can keep overriding company results for another week. If you missed the inflation side of this story, our CPI day chart setups guide covers how to prepare levels before a macro release.
Common mistakes when trading after earnings
- Buying the headline beat in the first minutes, before the call and the outlook are digested.
- Assuming a beat means the stock must go up, and averaging down when it does not.
- Holding a full position through the report with a stop that a normal earnings gap can jump over.
- Ignoring the index. On a day like October 14, a weak market can sink a strong report.
- Treating one candle as the verdict. Use the reaction range and a close beyond it, as covered in the most reliable candlestick patterns.
Frequently Asked Questions
Why do stocks drop after good earnings?
The price already reflects what investors expected. If the beat was priced in, the outlook was cautious, the beat came from a volatile business line, or the whole market is falling on macro news, the stock can drop even on strong results.
Why did bank stocks fall after Q3 2026 earnings?
CNBC reported that all six major US bank stocks fell after their October 13 and 14, 2026 reports, even those that beat. The reaction was tied to worries about persistent inflation, rising interest rates and capital markets, plus a hot September CPI report on October 14.
Should I buy a stock right after it beats earnings?
Not on the headline alone. The first move after a report is often reversed. A calmer approach is to mark the reaction range, wait for a daily close above clear resistance, and size the trade from the stop.
What is post earnings announcement drift?
It is the tendency, first documented by Ball and Brown in 1968, for prices to keep drifting in the direction of an earnings surprise for weeks after the report. Studies suggest the effect has weakened over time, so use it as context, not as a signal.
How do I size a trade after earnings?
Choose your risk per trade first, then divide by the stop distance. With $100 at risk and a $4 stop, that is 25 shares. On NAS100, US30 or SPX500 at $1 per point per 1.0 lot, a 200 point stop with $100 at risk is 0.5 lot.
Which earnings reports are next after the banks?
For the week of October 19, 2026, the Earnings Whispers calendar lists Netflix and Capital One after the close on October 20, Tesla after the close on October 21, and American Express before the open on October 23.
Risk Disclaimer: Trading stocks, options, futures, forex, and cryptocurrencies involves substantial risk of loss and is not suitable for every investor. Past performance does not guarantee future results. This article is for educational purposes only and does not constitute financial advice. Earnings figures and stock moves cited are as reported by the linked sources on the dates shown. You should carefully consider your financial situation and risk tolerance before trading. Never trade with money you cannot afford to lose.