EURUSD
EURUSD vs USDJPY Correlation: Why They Mirror Each Other and When They Split
EURUSD and USDJPY usually move in opposite directions. The US dollar is the quote currency in EURUSD and the base currency in USDJPY, so a broad dollar rally pushes EURUSD down and USDJPY up on the same day. On ECB reference rates to November 13, 2026, the correlation of their daily returns was -0.54 over one year and -0.42 over three months, and the two pairs closed in opposite directions on 188 of the last 256 fixing days.
That is a real link, but a much looser one than most traders assume. On yen days the two pairs can split completely, and USDJPY swings more than EURUSD in percentage terms. This comparison covers the correlation by time frame, how it changed over two years, real dollar days and yen days, how much risk you stack by trading both and how to size each leg. You can check the current reading on the free SIWAI EURUSD vs USDJPY correlation page.
Why EURUSD and USDJPY move in opposite directions
EURUSD is the price of one euro in US dollars. USDJPY is the price of one US dollar in Japanese yen. When the dollar strengthens against everything, EURUSD falls and USDJPY rises. That shared dollar leg is why the correlation coefficient between the two pairs is negative most of the time.
The other legs are where they differ. The euro reacts to the European Central Bank and to European data. The yen reacts to the Bank of Japan, to Japanese government bond yields and to risk appetite, because traders often buy yen when markets fall. Both pairs are among the most traded in the world (see the BIS Triennial Survey 2025), so dollar news hits both at once, but euro news and yen news do not.
There is a simple way to see how much the two legs disagree: multiply them. EURUSD times USDJPY is EURJPY. When EURUSD and USDJPY move in opposite directions by similar amounts, EURJPY barely moves. When they split, EURJPY moves a lot. Our EURJPY correlation guide covers that cross in detail.
EURUSD vs USDJPY correlation by time frame
The inputs are ECB euro reference rates (see the ECB reference rates page) loaded through the Frankfurter exchange rate API, converted to dollar pairs and compared as daily percentage returns. All windows end on November 13, 2026.
| Window | Start | Correlation | Opposite days |
|---|---|---|---|
| 1 month | Oct 13, 2026 | -0.36 | 15 of 23 (65%) |
| 3 months | Aug 13, 2026 | -0.42 | 47 of 66 (71%) |
| 6 months | May 14, 2026 | -0.42 | 96 of 131 (73%) |
| 1 year | Nov 12, 2025 | -0.54 | 188 of 256 (73%) |
| 2 years | Nov 4, 2024 | -0.58 | 368 of 517 (71%) |
How to read it in practice:
- A reading of -0.54 means a clear but partial mirror. Roughly one day in four, the two pairs moved the same way.
- The short windows are weaker than the long ones. Over the last month the reading was only -0.36.
- A negative correlation between these two pairs means the same dollar view, not a hedge. Selling EURUSD and buying USDJPY are both dollar longs.
How the EURUSD and USDJPY link changed over two years
A rolling three month window shows how unstable the relationship is. Each reading below covers the three months that end on that date.
| Three months ending | Correlation |
|---|---|
| Apr 2, 2025 | -0.20 |
| Jul 3, 2025 | -0.80 |
| Sep 30, 2025 | -0.82 |
| Jan 29, 2026 | -0.70 |
| Apr 30, 2026 | -0.60 |
| Jul 29, 2026 | -0.37 |
| Sep 25, 2026 | -0.54 |
| Nov 13, 2026 | -0.42 |
The link was strongest in the second half of 2025, when the dollar drove both pairs, and it has loosened through 2026. The weakest stretch in the data ended in early April 2025, when the reading fell to -0.20. Treat any single reading as a snapshot, and check the live EURUSD vs USDJPY correlation before you trade both.
Which pair moves more: EURUSD or USDJPY?
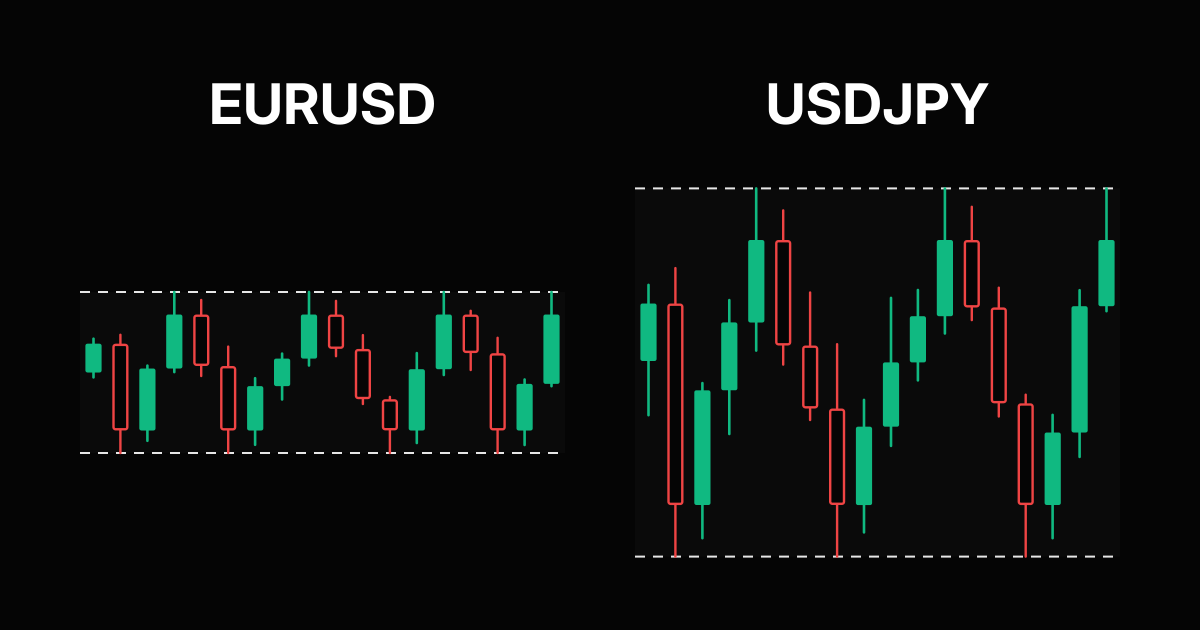
USDJPY. Measured as the standard deviation of daily returns, USDJPY moved 0.466% a day over three months against 0.324% for EURUSD, about 1.4 times as much. Over one year the figures were 0.479% and 0.350%.
| Window | EURUSD change | USDJPY change |
|---|---|---|
| 3 months | -4.18% (1.1534 to 1.1052) | +0.42% (159.33 to 160.00) |
| 1 year | -4.53% (1.1576 to 1.1052) | +3.37% (154.79 to 160.00) |
The table also shows why the correlation is only partial. Over three months EURUSD fell more than 4% while USDJPY rose less than half a percent, so much of that move was euro weakness rather than a broad dollar rally. That is exactly the kind of stretch where the correlation loosens.
Dollar day or yen day: real examples
Moves between two ECB fixings, from the close of the first date to the next. These are the days that decide whether a pair of trades behaves like one position or two.
| Dates | EURUSD | USDJPY | What drove it |
|---|---|---|---|
| Nov 10 to 13, 2026 | -1.44% | +1.15% | Dollar rally, classic mirror |
| Apr 7 to 8, 2026 | +1.29% | -1.06% | Dollar selloff, classic mirror |
| Jan 23 to 26, 2026 | +0.80% | -2.50% | Yen surge on top of a weaker dollar |
| Sep 2 to 3, 2026 | +0.32% | -2.25% | Mostly a yen day |
| Apr 29 to 30, 2026 | -0.03% | -2.02% | Pure yen day, EURUSD flat |
| Oct 30 to Nov 2, 2026 | +0.39% | +0.41% | Same direction: yen weakness, not the dollar |
Two lessons. First, the biggest USDJPY moves in the year were yen moves, and EURUSD often barely reacted. Second, the two pairs can rise together when the yen weakens while the euro firms, as they did into November 2. If you hold a short EURUSD and a long USDJPY as two dollar bets, a yen day can turn one of them into a large loss while the other does nothing.
Which pairs each one moves with
The two pairs sit in different families. EURUSD tracks the other dollar majors, while USDJPY tracks the yen crosses. One year correlations to November 13, 2026:
| Pair | With EURUSD | With USDJPY |
|---|---|---|
| GBPUSD | 0.86 | -0.49 |
| USDCHF | -0.83 | 0.58 |
| NZDUSD | 0.74 | -0.43 |
| AUDUSD | 0.69 | -0.32 |
| USDCAD | -0.61 | 0.38 |
| EURJPY | 0.22 | 0.70 |
| GBPJPY | 0.15 | 0.66 |
| AUDJPY | 0.14 | 0.56 |
So EURUSD has closer partners than USDJPY: GBPUSD at 0.86 and USDCHF at -0.83. USDJPY moves most with EURJPY and GBPJPY. See the USDJPY correlation guide for the full yen picture and how to use correlation in forex for the basics.
How much risk you stack trading both
Correlation tells you whether two trades add up or offset. Take two trades that each risk 1% of the account, and assume each loses in line with its own volatility.
| Trades | Dollar view | Combined risk (1Y, -0.54) | Combined risk (3M, -0.42) |
|---|---|---|---|
| Short EURUSD and long USDJPY | Both long the dollar | about 1.75% | about 1.69% |
| Long EURUSD and short USDJPY | Both short the dollar | about 1.75% | about 1.69% |
| Long EURUSD and long USDJPY | Opposite dollar views | about 0.96% | about 1.08% |
The math is the standard two asset formula: the square root of 1 plus 1 plus 2 times the correlation of the two positions. A short EURUSD and a long USDJPY have a position correlation of +0.54 over one year, so they behave like one bigger dollar trade of about 1.75%, not two separate 1% ideas. Opposite dollar views partly cancel, which mostly leaves you trading EURJPY.
A simple rule follows: if both trades say the same thing about the dollar, give them one risk budget and split it.
Sizing EURUSD and USDJPY from one risk budget
Pip values differ. One standard lot of EURUSD is worth $10 per pip. One standard lot of USDJPY is worth 1,000 yen per pip, which is $6.25 at 160.00. Example account: $10,000, total risk 1% ($100). Lots are rounded down to two decimals.
| Stop | EURUSD alone (1%) | USDJPY alone (1%) | Both, same dollar view (0.5% each) |
|---|---|---|---|
| 20 pips | 0.50 lots | 0.80 lots | 0.25 EURUSD + 0.40 USDJPY |
| 30 pips | 0.33 lots | 0.53 lots | 0.16 EURUSD + 0.26 USDJPY |
| 40 pips | 0.25 lots | 0.40 lots | 0.12 EURUSD + 0.20 USDJPY |
Check your own numbers with the EURUSD lot size calculator and the USDJPY lot size calculator, or read the EURUSD lot size guide and the USDJPY and GBPJPY lot size guide.
A five step EURUSD and USDJPY check
- Check the live three month correlation. Below -0.6 the pairs are mirroring; above -0.3 they are mostly independent.
- Name the driver: the dollar (US data, the Fed), the euro (ECB) or the yen (BoJ, risk appetite).
- Look at EURJPY. A big EURJPY move means the two legs are splitting and the mirror is weak.
- If both trades buy or both sell the dollar, give them one risk budget and split it.
- Size each leg from its own stop: $10 per pip on EURUSD, about $6.25 per pip on USDJPY at 160.00.
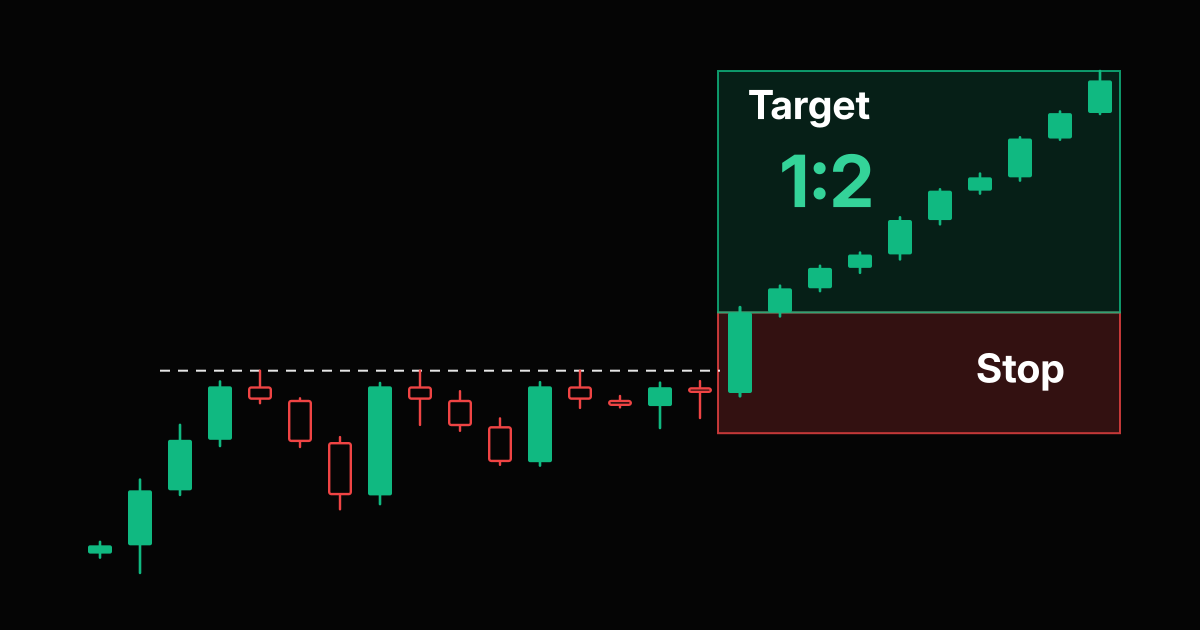
Before you size, check the payoff with the risk reward calculator or compare more pairs in the forex correlation matrix.
Frequently Asked Questions
Are EURUSD and USDJPY negatively correlated?
Yes, usually. On ECB reference rates to November 13, 2026, the correlation of their daily returns was -0.54 over one year, -0.42 over three months and -0.58 over two years. They closed in opposite directions on 188 of 256 days (73%) over the past year.
Why do EURUSD and USDJPY move in opposite directions?
Because the US dollar sits on opposite sides of the two quotes. It is the quote currency in EURUSD and the base currency in USDJPY, so a stronger dollar pushes EURUSD down and USDJPY up. The link weakens on days when the euro or the yen drives the move.
Is buying USDJPY and selling EURUSD a hedge?
No. Both trades are long the US dollar, so with a -0.54 correlation between the pairs they add up to about 1.75% of risk if each risks 1%. A long EURUSD and a long USDJPY are opposite dollar views and partly offset, leaving mostly a EURJPY position.
Which moves more, EURUSD or USDJPY?
USDJPY. Over three months to November 13, 2026, USDJPY daily returns had a standard deviation of 0.466% against 0.324% for EURUSD, about 1.4 times as much. The largest USDJPY moves of the year were yen moves, such as -2.50% from January 23 to 26, 2026.
How do I size EURUSD and USDJPY trades together?
Give same direction dollar trades one risk budget and split it. With a $10,000 account, 1% total risk and 20 pip stops, that is 0.25 lots of EURUSD ($10 per pip per lot) and 0.40 lots of USDJPY (about $6.25 per pip per lot at 160.00).
Risk Disclaimer: Trading stocks, options, futures, forex, commodities, and cryptocurrencies involves substantial risk of loss and is not suitable for every investor. Past performance does not guarantee future results. This article is for educational purposes only and does not constitute financial advice. You should carefully consider your financial situation and risk tolerance before trading. Never trade with money you cannot afford to lose. Correlation readings change over time and are calculated from daily ECB reference rates, which can differ from your broker's prices.