gold
Gold vs DXY Correlation: Why Gold Fell 5.5% as the Dollar Rose (Nov 2026)
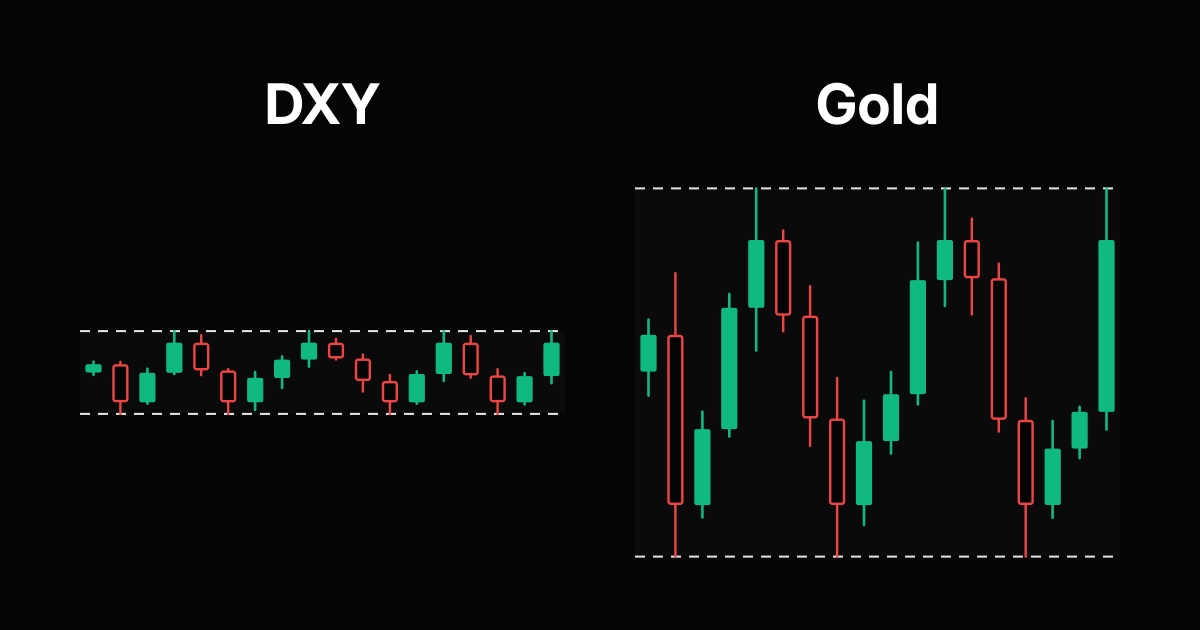
Gold and the US dollar index (DXY) usually move in opposite directions, and November 2026 is a textbook example. From November 9 to November 13, 2026, the DXY rose from 101.65 to 103.41 (+1.7%) while gold futures fell from $4,114.50 to $3,886.30 (-5.5%). Over the three months to November 13, the correlation of their daily returns was -0.46, and over one year the two closed in opposite directions on 163 of 252 trading days.
That is a real link, but not a fixed rule. Gold also fell on days the dollar fell, and in early 2025 the relationship briefly turned positive. This guide covers the gold vs DXY correlation from one month to two years, how it changed, the 2026 numbers month by month, the days it broke, how much gold moves per 1% in the dollar and how to size a gold trade around it. You can check the live reading on the free SIWAI gold vs DXY correlation page.
Gold and the dollar in November 2026
The second week of November was a dollar week. The DXY closed higher on four of five sessions, and gold lost more than $228 an ounce. US 10 year Treasury yields rose at the same time, from 4.86% on November 9 to 5.15% on November 13, which adds to the pressure on a metal that pays no interest.
| Date | Gold futures | DXY | US 10Y yield |
|---|---|---|---|
| Nov 9, 2026 | $4,114.50 | 101.65 | 4.86% |
| Nov 10, 2026 | $4,030.20 | 102.23 | 4.98% |
| Nov 11, 2026 | $4,000.50 | 102.91 | 5.00% |
| Nov 12, 2026 | $3,885.30 | 103.17 | 5.10% |
| Nov 13, 2026 | $3,886.30 | 103.41 | 5.15% |
Zoom out and the pattern holds for the whole year. Gold peaked at $5,318.40 on January 29, 2026, two sessions after the DXY made its 2026 low of 96.22 on January 27. Since then gold is down 26.9% and the dollar index is up 7.5%. Over the last month gold fell 6.8% while the DXY rose 1.4%.
Why gold usually moves against the dollar
The DXY measures the dollar against six currencies, with the euro at 57.6% of the basket (see the ICE US Dollar Index page and this USDX explainer). Gold is priced in dollars worldwide, so three forces push the two apart:
- Price effect. When the dollar gains, the same ounce costs more in euros, yen or pounds, which can cool demand from buyers outside the US.
- Yields. A strong dollar often comes with higher US yields. Gold pays no coupon, so higher yields raise the cost of holding it. Over three months, gold's correlation with daily changes in the 10 year yield was -0.29.
- Safe haven flows. Gold and the dollar compete as places to hide. When money runs to one, it sometimes leaves the other.
None of these forces works every day, which is why the correlation sits near -0.4 and not near -1. For the bigger demand picture, the World Gold Council demand trends report tracks central bank, ETF and jewelry buying each quarter.
Gold vs DXY correlation by time frame
The inputs are daily closes of front month COMEX gold futures and the ICE US Dollar Index from Yahoo Finance (gold history,DXY history), compared as daily returns. The correlation coefficient runs from -1 (perfect mirror) to +1 (perfect match). All windows end on November 13, 2026.
| Window | Start | Correlation | Opposite days |
|---|---|---|---|
| 1 month | Oct 15, 2026 | -0.33 | 11 of 21 (52%) |
| 3 months | Aug 17, 2026 | -0.46 | 39 of 63 (62%) |
| 6 months | May 15, 2026 | -0.47 | 80 of 126 (63%) |
| 1 year | Nov 12, 2025 | -0.39 | 163 of 252 (65%) |
| 2 years | Nov 14, 2024 | -0.37 | 324 of 501 (65%) |
How to read it in practice:
- A reading of -0.46 is a moderate inverse link. The dollar explains part of gold's daily move, not most of it.
- The last month is the weakest window at -0.33, with gold and the DXY moving apart on only 11 of 21 days, even though the week of November 9 was a clean mirror.
- About one day in three, gold and the dollar moved the same way. A dollar view alone is not a gold signal.
How the gold and dollar link changed since 2025
A rolling three month window shows how much the relationship moves. Each reading covers the three months that end on that date.
| Three months ending | Correlation |
|---|---|
| Feb 18, 2025 | +0.13 |
| Apr 17, 2025 | -0.30 |
| Jul 7, 2025 | -0.76 |
| Oct 17, 2025 | -0.44 |
| Dec 17, 2025 | -0.21 |
| Feb 19, 2026 | -0.43 |
| May 20, 2026 | -0.25 |
| Jul 22, 2026 | -0.53 |
| Oct 20, 2026 | -0.52 |
| Nov 13, 2026 | -0.46 |
The strongest inverse stretch ended on July 7, 2025, at -0.76. The weakest came in February 2025, when the reading was briefly positive. Since July 1, 2026, every daily reading has stayed between -0.60 and -0.41, a steadier stretch than most of 2025. Check the live gold vs DXY correlation before you lean on it.
Gold and the DXY month by month in 2026
Month end closes show the slow version of the same story: a weaker dollar early in the year, then a stronger one as gold slid.
| Month end | Gold futures | DXY |
|---|---|---|
| Jan 30 | $4,745.10 | 96.99 |
| Feb 27 | $5,247.90 | 97.61 |
| Mar 31 | $4,647.60 | 99.96 |
| Apr 30 | $4,629.60 | 98.08 |
| May 29 | $4,593.00 | 98.91 |
| Jun 30 | $4,038.50 | 101.19 |
| Jul 31 | $4,107.00 | 99.80 |
| Aug 31 | $4,481.50 | 99.43 |
| Sep 30 | $4,186.70 | 101.45 |
| Oct 30 | $3,898.90 | 101.88 |
| Nov 13 | $3,886.30 | 103.41 |
Year to date, gold is down 10.2% (from $4,329.60 on the first 2026 close) and the DXY is up 5.1% (from 98.42). Notice July and August: the dollar eased and gold bounced from $4,038.50 to $4,481.50. When the dollar turned up again in September, gold rolled over.
When gold and the dollar move together
The inverse link breaks on big risk days. These are real sessions from the last year:
- January 28, 2026: gold +4.35% and the DXY +0.24%. Both rose on the same day.
- January 30, 2026: gold -10.78% while the DXY rose 0.74%. The direction fit the rule, but the size did not. No correlation reading predicts a 10% day.
- March 19, 2026: gold -5.93% and the DXY -0.86%. Both fell together.
- September 16, 2026: gold +1.26% and the DXY +0.66%. Both rose together.
The lesson: a dollar move gives you a lean, not a guarantee. On days with heavy liquidation or safe haven buying, gold can follow its own flows. Scheduled US events, like the FOMC meetings, are when both can jump at once.
How much gold moves for a 1% move in the DXY
Over the last year, a regression of gold's daily returns on the DXY's gives a slope of about -2.1: on average, a 1% rise in the dollar index came with a 2.1% drop in gold. Treat that as a rough average, because with a correlation near -0.4 most of gold's daily move comes from other things.
Gold is also far more volatile. Its typical daily move over one year was 1.78% against 0.33% for the DXY, about 5.4 times larger. Over the last three months the average daily move was 1.07% for gold and 0.26% for the DXY. That is why a quiet dollar day can still be a big gold day.
What else gold moves with
The dollar is not gold's strongest link. Here is gold against four markets over the same windows to November 13, 2026.
| Gold vs | 1 month | 3 months | 1 year |
|---|---|---|---|
| Silver | 0.90 | 0.85 | 0.82 |
| Bitcoin | 0.33 | 0.50 | 0.24 |
| DXY | -0.33 | -0.46 | -0.39 |
| US 10Y yield (daily change) | -0.16 | -0.29 | -0.19 |
Silver is close to a twin, so a gold and silver long is mostly one trade. Bitcoin tracked gold more than usual over three months. For oil, copper and the gold to oil ratio, see our gold and oil correlation guide.
How much risk you stack trading gold with the dollar
Correlation decides whether two trades act like one big position or two smaller ones. With 1% risk on each leg, the combined swing is roughly the square root of (1 + 1 + 2 x correlation) percent, using the three month readings:
| Two trades, 1% risk each | Correlation | Behaves like |
|---|---|---|
| Long gold + long silver | 0.85 | about 1.92% |
| Long gold + long bitcoin | 0.50 | about 1.73% |
| Long gold + short DXY | +0.46 (same direction) | about 1.71% |
| Long gold + long DXY | -0.46 | about 1.04% |
A gold long and a dollar short are the same bet twice: both win if the dollar weakens. Give them one risk budget. A gold long with a dollar long partly offsets, but at -0.46 it is a loose hedge, not insurance.
Sizing a gold trade from one risk budget
With standard CFD specs, 1.0 lot of XAUUSD is 100 ounces, so a $1 move in gold is $100 per lot and 0.01 lot is $1 per $1 move. Some brokers use other contract sizes, so check your platform. On a $10,000 account risking 1% ($100):
| Stop distance | Risk per 1.0 lot | Lot size for $100 risk |
|---|---|---|
| $10 | $1,000 | 0.10 |
| $20 | $2,000 | 0.05 |
| $40 | $4,000 | 0.02 (0.025 rounded down) |
| $60 | $6,000 | 0.01 (0.016 rounded down) |
At $3,886, gold's average daily move over three months (1.07%) is about $41, so a stop under $20 can be hit by normal noise. If you also hold a dollar short, split the $100 between both legs. Our XAUUSD lot size guide and the XAUUSD lot size calculator do the math for any stop.
A five step gold and dollar check
- Check the live three month gold vs DXY correlation. Below -0.5 the dollar matters a lot; above -0.2 it barely matters.
- Look at the DXY trend and US yields. A rising dollar with rising yields is the worst mix for gold longs.
- Mark US events (CPI, jobs, FOMC). Both can gap at once.
- If a gold long and a dollar short sit in the same account, give them one risk budget.
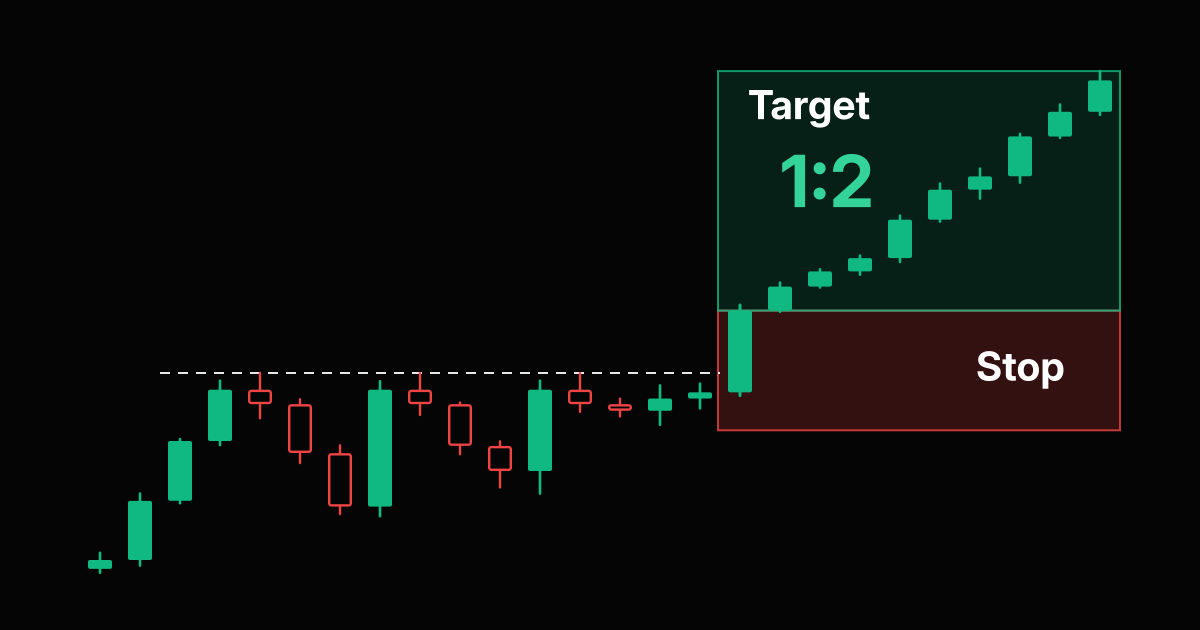
- Size gold from its stop: $100 per $1 move per 1.0 lot, and keep the stop wider than normal noise.
Before you size, check the payoff with the risk reward calculator or compare more markets in the commodity correlation matrix. New to correlation? Start with how to use correlation in forex.
Frequently Asked Questions
Is gold negatively correlated with the US dollar?
Usually, yes. On daily closes of COMEX gold futures and the ICE US Dollar Index to November 13, 2026, the correlation was -0.33 over one month, -0.46 over three months, -0.47 over six months, -0.39 over one year and -0.37 over two years. Over one year, the two closed in opposite directions on 163 of 252 trading days.
Why does gold go down when the dollar goes up?
Gold is priced in dollars, so a stronger dollar makes each ounce more expensive for buyers using other currencies. A rising dollar also tends to come with higher US yields, which raises the cost of holding a metal that pays no interest. From November 9 to 13, 2026, the DXY rose 1.7%, the 10 year yield rose from 4.86% to 5.15% and gold fell 5.5%.
How strong is the gold and DXY correlation right now?
Moderate. The three month reading to November 13, 2026 was -0.46. Since July 1, 2026, the rolling three month reading has stayed between -0.60 and -0.41. Its strongest level in the last two years was -0.76 in the window to July 7, 2025, and it was briefly positive (+0.13) in February 2025.
Does gold always move opposite to the dollar?
No. About one day in three they move the same way. On March 19, 2026, gold fell 5.93% and the DXY fell 0.86%. On January 28, 2026, gold rose 4.35% and the DXY rose 0.24%. Treat the dollar as a lean on gold, not a rule.
How much does gold move when the DXY moves 1%?
Over the year to November 13, 2026, a regression of daily returns gives a slope of about -2.1, so a 1% rise in the DXY came with a 2.1% fall in gold on average. The fit is loose because the correlation is only about -0.4, and gold is about 5.4 times as volatile as the DXY (1.78% vs 0.33% typical daily move).
How do I size a gold trade?
With standard CFD specs, 1.0 lot of XAUUSD is 100 ounces, so a $1 move is $100 per lot and 0.01 lot is $1 per $1 move. Risking $100 with a $20 stop gives 0.05 lot. If you also hold a dollar short, that is the same bet, so split one risk budget between the two. Check your broker's contract size.
Risk Disclaimer: Trading stocks, options, futures, forex, commodities, and cryptocurrencies involves substantial risk of loss and is not suitable for every investor. Past performance does not guarantee future results. This article is for educational purposes only and does not constitute financial advice. You should carefully consider your financial situation and risk tolerance before trading. Never trade with money you cannot afford to lose. Correlation readings change over time and are calculated from daily futures and index closes, which can differ from your broker's prices.