gold
Gold and Oil Correlation in 2026: Why Brent Rose While Gold Fell
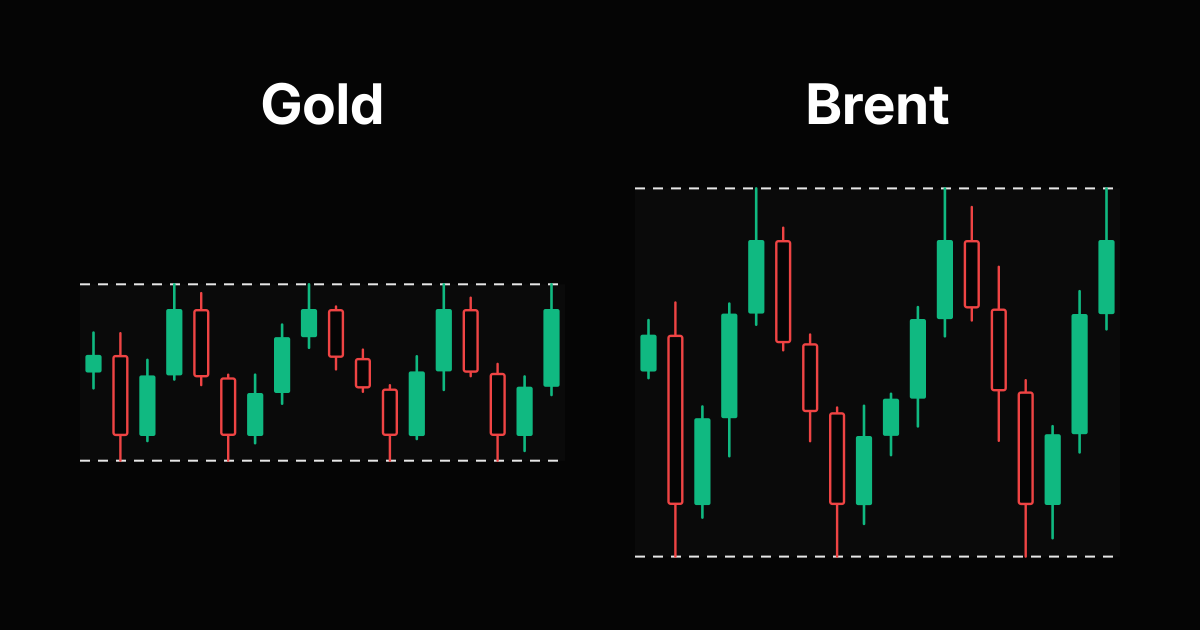
Gold and oil are both priced in dollars and both get called inflation trades, so many traders treat a long in each as two separate ideas that happen to agree. The 2026 data says otherwise. Over the three months to October 30, 2026, the correlation of daily returns between gold and Brent crude was -0.20. Brent rose 29.6% in that window while gold fell 3.4%.
This Value guide gives you the real gold correlation numbers against Brent, WTI, copper, silver and the dollar index, two years of rolling readings, the gold to oil ratio, and a simple way to turn a correlation into one risk budget with lot sizes. Every reading uses the same method as the free Brent vs gold correlation tool, so you can check the live value before your next trade.
Gold and oil in late 2026: moving apart
The numbers below are front month futures closes from Yahoo Finance (gold, Brent and WTI), up to the close of Friday, October 30, 2026. For a longer official oil history, the St. Louis Fed publishes daily Brent spot prices as FRED series DCOILBRENTEU, and the World Gold Council keeps the gold price history.
| Market | Close Oct 30, 2026 | 3 months ago | Change in 3 months | Change in 1 year |
|---|---|---|---|---|
| Gold (per ounce) | $3,898.90 | $4,036.30 | -3.4% | -5.8% |
| Brent (per barrel) | $117.64 | $90.74 | +29.6% | +78.4% |
| WTI (per barrel) | $104.12 | $84.46 | +23.3% | +69.3% |
Inside the three month window the two markets went in opposite directions from very different starting points. Gold peaked at $4,697.80 on August 24 and closed October 30 at its lowest close of the window, 17.0% lower. Brent made its low of $79.36 on August 4 and closed October 30 at its highest close of the window, 48.2% higher. Oil also moved about twice as much per day: the average daily move was 1.90% for Brent and 1.01% for gold.
Gold correlation table: oil, copper, silver and the dollar
A correlation coefficient runs from -1 (always opposite) to +1 (always together). Each cell is the Pearson correlation of daily percent changes over the calendar window ending October 30, 2026, using only days where both markets traded, which is how the SIWAI correlation tools compute it.
| Pair | 1 month | 3 months | 6 months | 1 year |
|---|---|---|---|---|
| Gold vs Brent | -0.37 | -0.20 | -0.28 | -0.19 |
| Gold vs WTI | -0.15 | -0.15 | -0.26 | -0.15 |
| Gold vs copper | 0.40 | 0.43 | 0.55 | 0.57 |
| Gold vs silver | 0.87 | 0.84 | 0.82 | 0.82 |
| Gold vs US dollar index | -0.06 | -0.44 | -0.48 | -0.37 |
| Brent vs WTI | 0.66 | 0.85 | 0.93 | 0.91 |
Three things stand out:
- Gold and oil are mildly negative, not positive. A long in both is not one bet in 2026, it is closer to two different bets.
- Gold and silver are the real twins at 0.82 to 0.87. Two longs there are mostly one trade. Compare them live on the gold vs silver correlation page.
- Brent and WTI split this month. The one month reading fell to 0.66 from 0.91 over a year, and the gap between them reached $13.52 on October 30. Two oil longs are still mostly the same position.
The copper link is worth a look too: gold vs copper was 0.57 over a year, so gold has been trading more like a metal than like an oil hedge. See the copper vs gold correlation, gold vs WTI correlation and gold vs dollar index correlation for the live numbers, or the full commodity correlation matrix.
Two years of gold and oil correlation
A single reading hides how much the link moves. Here is the three month gold vs Brent correlation at different points, each one the 93 days ending on the date shown, plus the gold to oil ratio (how many barrels of Brent one ounce of gold buys) on the last close of that window.
| Window ending | Gold vs Brent, 3 months | Gold to Brent ratio |
|---|---|---|
| Jan 8, 2025 | 0.51 | 35.1 |
| May 8, 2025 | 0.28 | 52.6 |
| Sep 5, 2025 | 0.00 | 55.8 |
| Jan 3, 2026 | -0.05 | 71.3 |
| Mar 4, 2026 | 0.18 | 63.1 |
| Jul 2, 2026 | -0.55 | 57.5 |
| Aug 31, 2026 | -0.12 | 49.5 |
| Oct 30, 2026 | -0.20 | 33.1 |
In early 2025 gold and oil still moved together at 0.51. Since the second half of 2025 the reading has sat near zero or below, with a low of -0.55 in the window to July 2, 2026. The ratio tells the price story: one ounce bought 71.3 barrels at the start of 2026 and only 33.1 barrels on October 30, the lowest value in this table, because oil rallied while gold fell.
The lesson for your trading is not that gold and oil are "negatively correlated" for good. It is that the link changes sign, so check it before you size, not once a year. For oil supply and demand background, the US Energy Information Administration publishes weekly inventory and price data, and ICE lists the Brent futures contract that most oil CFDs track.
How correlation changes the risk of trading both
Here is the practical part. Say you take two trades that each risk 1% of your account. If the markets were perfectly correlated, one bad day hits both stops and you lose 2%. If they move independently, the swings partly cancel. A common way to estimate the combined swing of two equal risks is:
Combined risk = risk per trade × square root of (2 + 2 × correlation)
With 1% on each trade and the readings above, that gives:
| Two longs | Correlation used | Behaves like a single risk of |
|---|---|---|
| Gold and Brent | -0.20 (3 months) | about 1.26% |
| Gold and copper | 0.57 (1 year) | about 1.77% |
| Gold and silver | 0.82 (1 year) | about 1.91% |
| Brent and WTI | 0.91 (1 year) | about 1.95% |
So in 2026 a gold long plus a Brent long is the more diversified pair, while gold plus silver or Brent plus WTI is almost a double position. A simple rule follows: when the correlation is above about 0.7, give the two trades one 1% budget and split it; below that, you can treat them as separate trades. A long gold and short oil pair at -0.20 works the other way round and behaves more like one trade, because both legs profit from the same divergence. Remember that correlation describes average days, not crash days, when many markets can fall together.
Sizing gold and oil from one budget
Standard CFD specs, as used in the SIWAI calculators: 1.0 lot of XAUUSD is 100 ounces, so each $1 move in gold is $100 per lot. 1.0 lot of UKOIL (Brent) or USOIL (WTI) is 1,000 barrels, so each $1 move in oil is $1,000 per lot, or $10 per $0.01. Position sizing starts from risk money, as Investopedia's position sizing guide explains:
Risk money = account equity × risk percent
Risk per 1.0 lot = stop distance in dollars × units per lot
Lot size = risk money ÷ risk per 1.0 lot
Example 1: $10,000 account, gold and Brent long at the same time, 1% each because the correlation is -0.20. The stops below are close to one average daily move at October 30 prices (1.01% of $3,898.90 is about $39 for gold, 1.90% of $117.64 is about $2.24 for Brent).
- Gold, $40 stop: risk per 1.0 lot is $40 × 100 = $4,000, so $100 ÷ $4,000 = 0.025, rounded down to 0.02 lot ($80 at risk)
- Brent, $2.50 stop: risk per 1.0 lot is $2.50 × 1,000 = $2,500, so $100 ÷ $2,500 = 0.04 lot ($100 at risk)
Example 2: same account, Brent and WTI long at the same time. At 0.91 they share one 1% budget, so each gets $50.
- Brent, $2.50 stop: $50 ÷ $2,500 = 0.02 lot ($50 at risk)
- WTI, $2.50 stop: $50 ÷ $2,500 = 0.02 lot ($50 at risk)
Always round down to your broker's volume step, and check its contract size, since some brokers quote oil in 100 barrel lots. Run your own numbers in the XAUUSD lots calculator, UKOIL lots calculator and USOIL lots calculator. Our XAUUSD lot size guide has ready tables for gold.
A five step check before trading gold and oil together
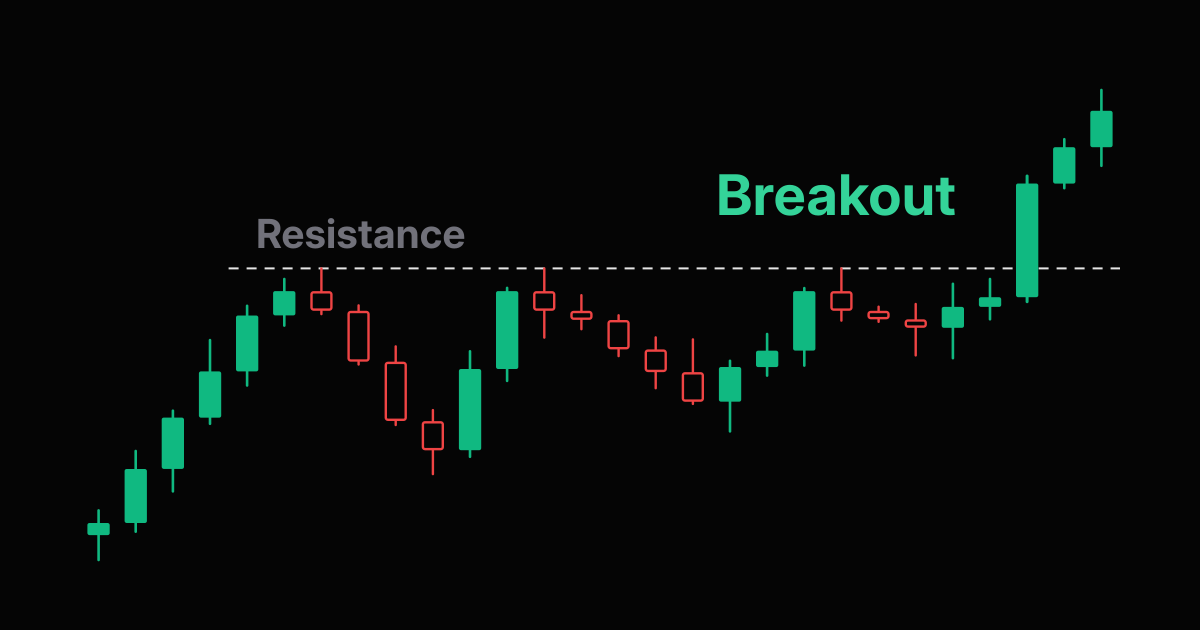
- Find a clean setup on each chart. A breakout through a clear resistance line, not a trade you take because the other market moved.
- Check the live correlation on 1 month and 3 months in the Brent vs gold tool. If the two windows disagree, use the higher reading.
- Pick the budget: above about 0.7, one 1% budget split in two; below that, 1% each.
- Size each leg from its own stop with the formula above, and round down.
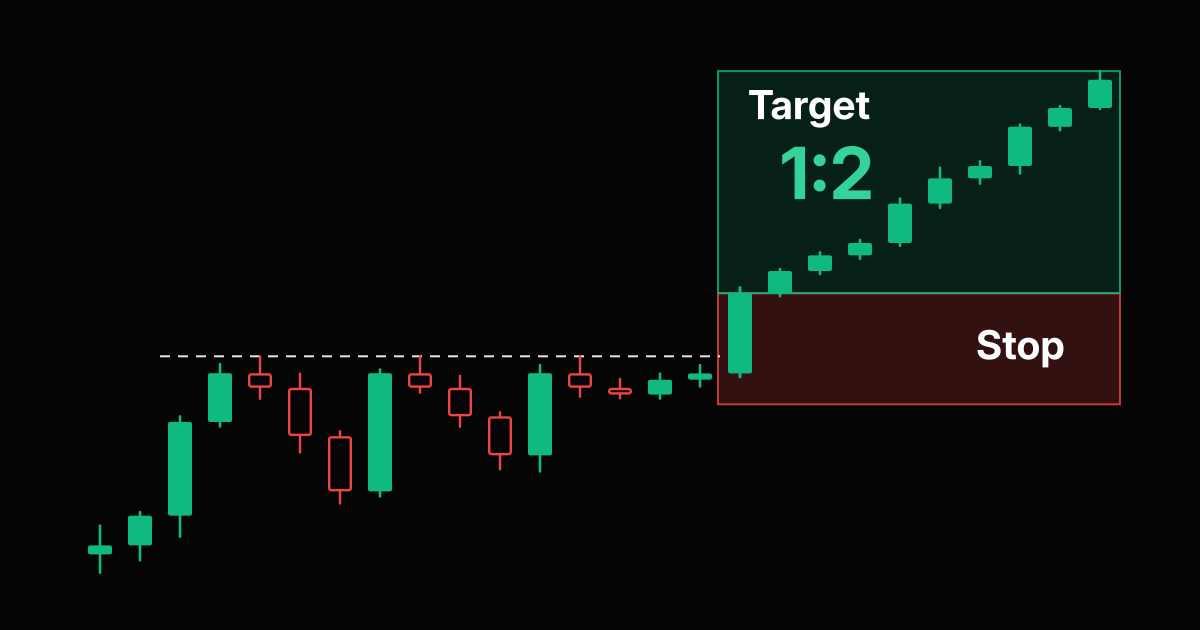
- Check the payoff with the risk reward calculator and skip any leg below 1:2. Our guide on how to calculate risk reward ratio shows the math.
For the same approach on currency pairs, read how to use correlation in forex and our USDCAD and oil correlation article.
Frequently Asked Questions
Are gold and oil correlated?
Only weakly, and in 2026 slightly negatively. On front month futures closes to October 30, 2026, the correlation of daily returns between gold and Brent was -0.37 over one month, -0.20 over three months, -0.28 over six months and -0.19 over one year. Gold and WTI read -0.15 over one year.
Do gold and oil prices move together?
They used to more often. The three month gold vs Brent correlation was 0.51 in the window to January 8, 2025, but it has been near zero or negative since the second half of 2025, with a low of -0.55 in the window to July 2, 2026. Over the three months to October 30, 2026, Brent rose 29.6% while gold fell 3.4%.
What is the gold to oil ratio right now?
On October 30, 2026, gold closed at $3,898.90 and Brent at $117.64, so one ounce of gold bought about 33.1 barrels. That compares with about 62.8 barrels a year earlier and 71.3 barrels at the start of 2026.
What is gold most correlated with?
Silver. The gold vs silver correlation of daily returns was 0.82 over one year and 0.87 over one month to October 30, 2026. Copper came next at 0.57 over one year, while the US dollar index was negative at -0.37 over one year and -0.48 over six months.
Can I trade gold and oil at the same time?
Yes. At a -0.20 correlation, two trades risking 1% each swing like about 1.26% of risk, so a gold long and a Brent long are closer to two separate trades than one. Gold with silver (0.82) or Brent with WTI (0.91) behave like about 1.91% and 1.95%, so those pairs should share one risk budget.
How much is a $1 move in gold and oil per lot?
With standard CFD specs, 1.0 lot of XAUUSD is 100 ounces, so a $1 move in gold is $100 per lot. 1.0 lot of UKOIL or USOIL is 1,000 barrels, so a $1 move in oil is $1,000 per lot and $0.01 is $10. Some brokers use other contract sizes, so check your platform.
Risk Disclaimer: Trading stocks, options, futures, forex, commodities, and cryptocurrencies involves substantial risk of loss and is not suitable for every investor. Past performance does not guarantee future results. This article is for educational purposes only and does not constitute financial advice. You should carefully consider your financial situation and risk tolerance before trading. Never trade with money you cannot afford to lose. Prices and correlations in this guide use front month futures closes up to October 30, 2026 and change every day. Contract sizes and minimum volumes vary by broker. Confirm the specification on your platform before sizing a live order.