inverse head and shoulders
Inverse Head and Shoulders Pattern: How to Spot It, Measure the Target and Trade the Breakout
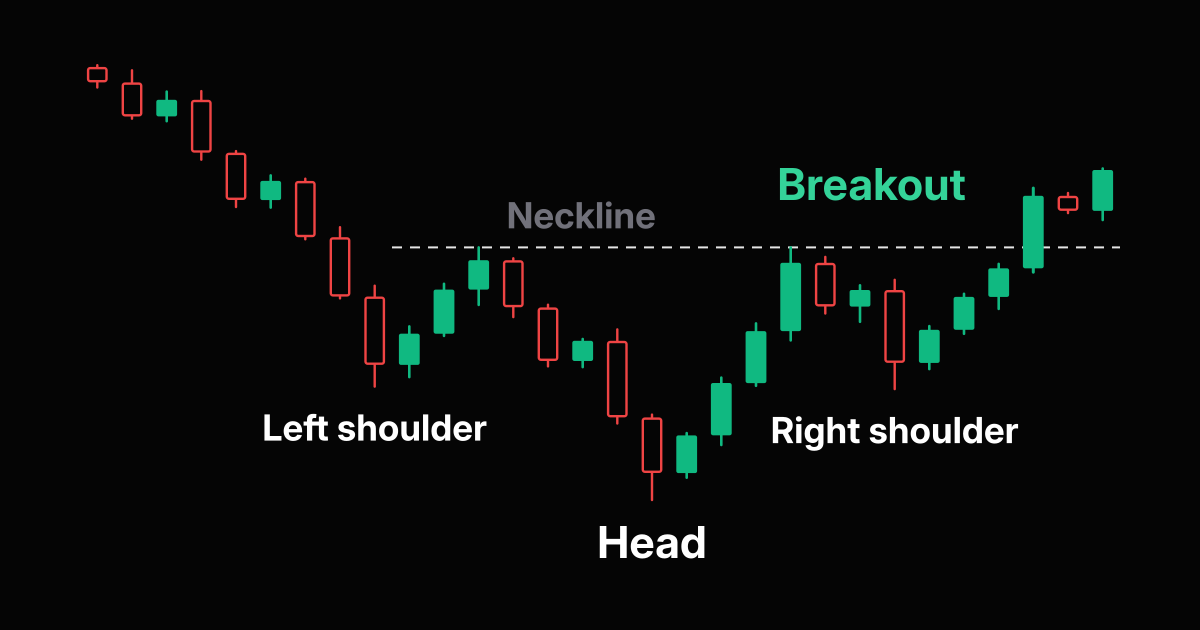
The inverse head and shoulders is a bullish reversal pattern. It forms at the end of a downtrend as three lows: a left shoulder, a deeper head and a right shoulder at about the same depth as the left one. A line across the two bounce highs between them is the neckline, and the pattern only counts once price closes above that neckline.
This Timeless guide covers the five rules that separate a real bottom from a random wiggle, how to measure the price target (with the classic exam question worked out), where the entry and stop go, and what the largest published study says about how often the pattern works. If you want the bearish twin first, read the head and shoulders pattern guide.
What an inverse head and shoulders is
Picture the classic head and shoulders top turned upside down. Sellers push price to a new low (left shoulder), buyers bounce it, sellers push to an even lower low (head), buyers bounce it again to about the same level, and then the next sell off fails to reach the head (right shoulder). That failure is the message: sellers can no longer make new lows. When buyers then push through the neckline, the downtrend is over.
You will also see it called a head and shoulders bottom, an inverted head and shoulders or a reverse head and shoulders. They are all the same pattern. StockCharts ChartSchool describes it as a major reversal pattern that forms after a downtrend, with three successive troughs and the middle one the deepest, and Investopedia files it under the same definition.
Is the inverse head and shoulders bullish?
Yes. The inverse head and shoulders is bullish because it marks the end of a decline. The classic head and shoulders (three peaks with the middle one highest) is bearish because it marks the end of a rally. A simple way to remember it: the head points in the direction of the old trend, and the breakout goes the other way.
| Feature | Inverse head and shoulders | Classic head and shoulders |
|---|---|---|
| Bias | Bullish reversal | Bearish reversal |
| Prior trend | Down | Up |
| Shape | Three lows, middle one lowest | Three highs, middle one highest |
| Neckline | Resistance across the two bounce highs | Support across the two reaction lows |
| Confirmation | Close above the neckline | Close below the neckline |
| Target | Neckline plus pattern height | Neckline minus pattern height |
Five rules for a valid inverse head and shoulders
- A real downtrend before it. A reversal pattern needs something to reverse. Three lows inside a sideways range are just a range.
- The head is clearly the lowest point. Both shoulders must hold above the head low. If the right shoulder undercuts the head, the pattern is gone.
- Shoulders that roughly match. Thomas Bulkowski's head and shoulders bottom guidelines ask for shoulders that bottom near the same price, sit at a similar distance from the head and look alike. A lopsided pattern is less reliable.
- Volume that grows on the way up. StockCharts calls volume crucial for bottoms: the rally off the right shoulder and the neckline break should come on expanding volume, while the pullback into the right shoulder should be quiet.
- A close above the neckline. Until a candle closes above the neckline, you are looking at a possible pattern, not a confirmed one. Wicks through the line do not count.
The neckline can be flat or sloped. A rising neckline means the second bounce got higher than the first, which StockCharts reads as more bullish. When the neckline slopes, draw it through both bounce highs and use the point where price crosses it as the breakout level.
How to measure the inverse head and shoulders target
The measured move rule has two steps. First, measure the height: the distance from the head low straight up to the neckline. Second, add that height to the neckline at the breakout point.
Height = neckline price above the head minus the head low
Target = breakout neckline price + height
This is the question that shows up in trading exams: in an inverse head and shoulders, the neckline is at 100, the shoulders at 90 and the head at 75. Where is the price target? The height is 100 minus 75, which is 25. The target is 100 plus 25, which is 125. The shoulders at 90 do not enter the math; they only confirm the shape.
Bulkowski adds a more conservative version. His study found that only 71% of head and shoulders bottoms in bull markets reached the full measured target, so he multiplies the height by 0.71 before adding it. In the example that is 25 × 0.71 = 17.75, for a first target of 117.75. Many traders take partial profit at the conservative level and leave the rest for the full 125.
How to trade it: entry, stop and position size
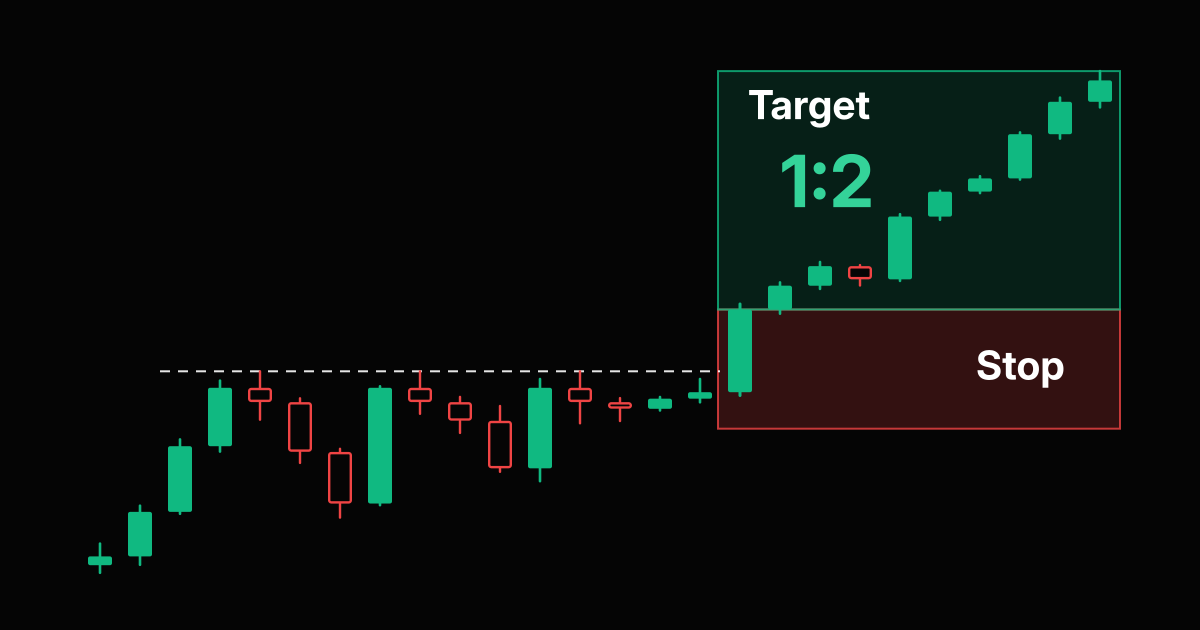
A plan for the inverse head and shoulders uses the same three numbers as any breakout trade: entry, stop and target. Using the example above with a right shoulder low at 88:
- Entry: on the close of the breakout candle, say 101.
- Stop: just under the right shoulder low, at 87.50. If price falls back below the right shoulder, the pattern has failed.
- Target: 117.75 (conservative) or 125 (full measured move).
The risk is 101 minus 87.50, which is 13.50 per share. The reward is 16.75 to the conservative target (about 1:1.24) and 24 to the full target (about 1:1.78). If the ratio to your realistic target is too small, skip the trade; the risk reward ratio guide shows how to check it before you enter.
Then size the position from the stop, not from a gut feeling. With a $10,000 account risking 1%, you can lose $100. Divide by the 13.50 stop distance and you get 7.4, so you buy 7 shares and risk $94.50. The free position size calculator does this for stocks, and the lots calculator does it for forex, gold and indices.
A tighter alternative is to wait for a retest. Bulkowski measured a throwback (price returning to the neckline after the breakout) in 65% of cases, so patient traders often buy the pullback to the old neckline with a stop just under it. The catch, in his data, is that patterns with a throwback performed worse afterward, and some never come back at all, so you will miss part of the best moves.
How reliable is the inverse head and shoulders?
The largest public dataset comes from Bulkowski, author of the Encyclopedia of Chart Patterns. On his head and shoulders bottom page, based on 3,197 patterns in bull markets, he reports:
| Statistic (bull market) | Result |
|---|---|
| Overall performance rank | 13 out of 39 patterns |
| Break even failure rate | 11% |
| Average rise after breakout | 45% |
| Throwback rate | 65% |
| Reached the measured target | 71% |
Those are statistics on stocks, measured on patterns that met his identification rules, so treat them as a description of the past rather than a promise. His notes also flag what hurt results: a higher left shoulder valley than the right one, throwbacks, and breakouts in a tall single bar after a steep drop. A short drop of up to three months into the pattern gave the best performance after the breakout.
For our own record of real breakouts, scored as hits and fails, see the breakout stocks vault.
Common inverse head and shoulders mistakes
- Buying the right shoulder. Guessing the bottom before the neckline breaks means you are trading a pattern that does not exist yet.
- Ignoring the trend above. A breakout straight into a falling 200 day average or old resistance has little room to run. Bulkowski lists overhead resistance as one of his trading traps.
- Measuring from the wrong point. The height runs from the head low to the neckline directly above it, not from a shoulder.
- Forcing the shape. Five or six lows with no clear head are a messy base, not this pattern.
- No volume check. On stocks, a neckline break on thin volume is the one most likely to fail.
Want more patterns with the same logic? The bull flag vs bull pennant guide covers continuation breakouts, and the most reliable candlestick patterns help you judge the breakout candle itself.
Frequently Asked Questions
Is an inverse head and shoulders bullish or bearish?
Bullish. It forms after a downtrend and signals a reversal higher once price closes above the neckline. The classic head and shoulders, with three peaks, is the bearish version.
How do you calculate the inverse head and shoulders target?
Measure the distance from the head low up to the neckline, then add that distance to the neckline at the breakout. With a neckline at 100 and a head at 75, the height is 25 and the target is 125.
What is the success rate of the inverse head and shoulders?
In Thomas Bulkowski's study of 3,197 bull market patterns, the head and shoulders bottom had an 11% break even failure rate, an average rise of 45% and reached its measured target 71% of the time. Past results do not guarantee future ones.
Where should the stop loss go on an inverse head and shoulders?
Most traders place it just below the right shoulder low, because a drop under that low breaks the pattern. Traders who buy a retest of the neckline often use a tighter stop just under the neckline.
When is the inverse head and shoulders confirmed?
Only when a candle closes above the neckline, ideally on rising volume. Until then the right shoulder is just a possible bottom, and the pattern can still fail.
What is the difference between an inverse and an inverted head and shoulders?
There is none. Inverse head and shoulders, inverted head and shoulders, reverse head and shoulders and head and shoulders bottom all name the same bullish reversal pattern.
Risk Disclaimer: Trading stocks, options, futures, forex, commodities, and cryptocurrencies involves substantial risk of loss and is not suitable for every investor. Past performance does not guarantee future results. This article is for educational purposes only and does not constitute financial advice. You should carefully consider your financial situation and risk tolerance before trading. Never trade with money you cannot afford to lose. Chart pattern statistics cited here come from third party studies of past data and do not predict future results. Examples use illustrative prices.