GBPJPY
GBPJPY Correlation: Which Pairs Double Your Risk and Which Hedge It
GBPJPY moves most with EURJPY and the other yen crosses, and much less with GBPUSD than most traders expect. On ECB reference rates over the year to November 11, 2026, its daily returns had a 0.90 correlation with EURJPY, 0.81 with AUDJPY and 0.66 with USDJPY, but only 0.33 with GBPUSD. Against EURGBP it was negative, at -0.36.
That matters for one practical reason: if you hold GBPJPY next to EURJPY or USDJPY, you are mostly taking the same trade twice. This guide gives you the full correlation table, shows how much risk you really stack with each pair, which pair partly hedges GBPJPY, and how to size the position so the total stays inside your plan. You can check the live numbers on the free GBPJPY vs GBPUSD correlation page and the GBPJPY vs USDJPY correlation page.
GBPJPY is GBPUSD times USDJPY
GBPJPY is a cross rate built from two dollar pairs. On the November 11, 2026 ECB fix, GBPUSD was 1.3307 and USDJPY was 159.23, and 1.3307 × 159.23 = 211.89, which is the GBPJPY fix. So the daily percentage change of GBPJPY is close to the change of GBPUSD plus the change of USDJPY.
November 11 shows it well. From the November 10 fix, GBPUSD fell 0.86% and USDJPY rose 0.66%, so GBPJPY only slipped 0.20% (43 pips). The pound fell and the yen fell, both against the dollar, and the two moves mostly cancelled inside GBPJPY.
- On a yen day (a Bank of Japan surprise, a risk off selloff, an intervention warning) every yen pair moves together, so GBPJPY tracks EURJPY, USDJPY and AUDJPY.
- On a pound day (a Bank of England decision, UK inflation or jobs data) GBPJPY tracks GBPUSD and GBPCHF, while USDJPY can stay still.
You can follow the two central banks on the Bank of England monetary policy page and the Bank of Japan monetary policy page.
GBPJPY correlation table: every major pair
The inputs are daily ECB euro reference rates (see the ECB euro to pound page and the ECB euro to yen page) loaded through the Frankfurter exchange rate API, converted to dollar pairs and crosses and compared as daily percentage returns. Every window ends on November 11, 2026. The two year window starts on November 1, 2024. Rows are sorted by the one year reading.
| GBPJPY vs | 1 month | 3 months | 6 months | 1 year | 2 years |
|---|---|---|---|---|---|
| EURJPY | 0.90 | 0.93 | 0.92 | 0.90 | 0.87 |
| AUDJPY | 0.76 | 0.77 | 0.79 | 0.81 | 0.79 |
| CADJPY | 0.69 | 0.81 | 0.80 | 0.77 | 0.79 |
| CHFJPY | 0.76 | 0.74 | 0.79 | 0.76 | 0.73 |
| NZDJPY | 0.71 | 0.74 | 0.74 | 0.76 | 0.77 |
| USDJPY | 0.39 | 0.77 | 0.71 | 0.66 | 0.67 |
| GBPCHF | 0.45 | 0.34 | 0.31 | 0.39 | 0.52 |
| GBPUSD | 0.69 | 0.30 | 0.37 | 0.33 | 0.29 |
| AUDUSD | 0.67 | 0.18 | 0.27 | 0.28 | 0.24 |
| NZDUSD | 0.52 | 0.10 | 0.18 | 0.18 | 0.16 |
| EURUSD | 0.63 | 0.17 | 0.25 | 0.15 | 0.07 |
| USDCHF | -0.36 | 0.05 | -0.09 | -0.02 | 0.12 |
| USDCAD | -0.40 | 0.07 | -0.08 | -0.12 | -0.13 |
| EURGBP | -0.20 | -0.23 | -0.28 | -0.36 | -0.39 |
What the table tells you:
- EURJPY is the twin. 0.87 to 0.93 on every window from three months up. GBPJPY divided by EURJPY is GBP per EUR, and EURGBP moves slowly, so the two crosses rarely split.
- The other yen crosses are close behind. AUDJPY, CADJPY, CHFJPY and NZDJPY sit between 0.73 and 0.81 over one and two years.
- USDJPY is moderate to strong. 0.66 over one year and 0.77 over three months. It shares the yen leg, not the pound leg.
- GBPUSD is weak. Only 0.29 to 0.37 from three months up, even though both pairs carry the pound. Dollar pairs like EURUSD, USDCHF and USDCAD are close to zero.
- EURGBP is negative. -0.36 over one year. A long EURGBP is short the pound, so it pushes against a long GBPJPY on pound days.
The direction counts agree. Over one year (256 daily changes), GBPJPY closed in the same direction as EURJPY on 208 days (81%), as USDJPY on 174 (68%), as GBPUSD on 161 (63%) and as EURGBP on only 92 (36%). The one month column is noisy: with 23 fixes, GBPUSD reads 0.69 and USDJPY only 0.39, a sign the pound has been doing more of the moving since mid October.
How the GBPJPY links changed over the year
Each row is the correlation of daily returns over the three months ending on that date. It shows which leg was in charge.
| 3 months ending | vs USDJPY | vs EURJPY | vs GBPUSD |
|---|---|---|---|
| Nov 27, 2025 | 0.71 | 0.86 | 0.30 |
| Dec 30, 2025 | 0.77 | 0.87 | 0.24 |
| Jan 29, 2026 | 0.78 | 0.85 | 0.01 |
| Feb 27, 2026 | 0.70 | 0.85 | 0.20 |
| Mar 30, 2026 | 0.64 | 0.86 | 0.34 |
| Apr 30, 2026 | 0.51 | 0.89 | 0.49 |
| Jun 1, 2026 | 0.40 | 0.89 | 0.52 |
| Jun 30, 2026 | 0.39 | 0.90 | 0.57 |
| Jul 29, 2026 | 0.57 | 0.90 | 0.56 |
| Aug 27, 2026 | 0.67 | 0.93 | 0.38 |
| Sep 25, 2026 | 0.85 | 0.96 | 0.07 |
| Oct 26, 2026 | 0.87 | 0.95 | 0.10 |
| Nov 11, 2026 | 0.77 | 0.93 | 0.30 |
- EURJPY never let go. Between 0.85 and 0.96 in every window.
- USDJPY came and went. From 0.78 at the end of January it dropped to 0.39 at the end of June, when GBPUSD rose to 0.57 and the pound was driving, then climbed back to 0.87 in October as the yen took over.
- GBPUSD never got strong. Its highest reading in the table is 0.57. GBPJPY is not a stand in for GBPUSD, even in a pound driven stretch.
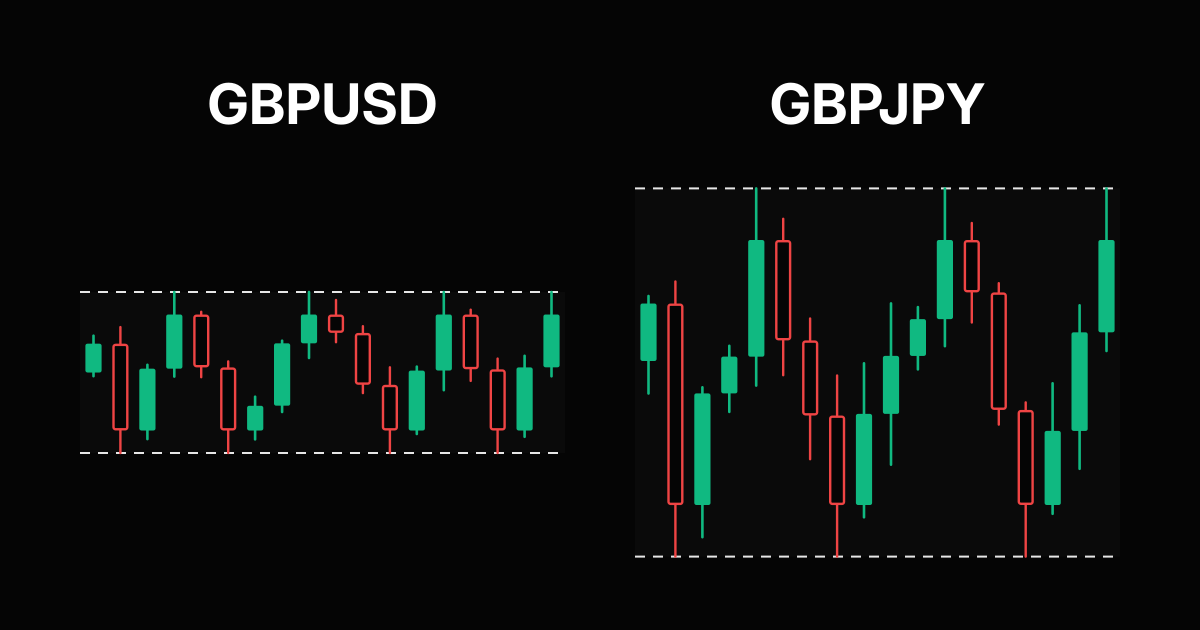
Pound day or yen day: real examples
Split any GBPJPY move into its two legs and you know which pairs it repeats. Five real stretches:
| Period | GBPJPY | GBPUSD | USDJPY | EURJPY | Driver |
|---|---|---|---|---|---|
| Apr 29 to Apr 30, 2026 | -2.03% | -0.01% | -2.02% | -2.05% | Yen |
| Jul 31 to Aug 3, 2026 | -1.87% | +0.36% | -2.22% | -1.80% | Yen |
| Sep 2 to Sep 3, 2026 | -2.15% | +0.10% | -2.25% | -1.94% | Yen |
| Aug 11 to Nov 11, 2026 | -1.41% | -1.43% | +0.02% | -3.56% | Pound (and euro) |
| Nov 10, 2025 to Nov 11, 2026 | +4.31% | +0.95% | +3.33% | -0.64% | Mostly yen |
The three biggest GBPJPY days of the year, 462 pips on September 3, 439 on April 30 and 401 on August 3, were all yen moves: USDJPY and EURJPY fell by about the same amount while GBPUSD barely moved. A trader long GBPJPY, EURJPY and USDJPY on those days took three losses from one cause. Over the last three months it was the reverse: USDJPY ended flat and the whole 303 pip GBPJPY drop came from the pound.
Over the full year, GBPJPY traded between 202.60 (November 14, 2025) and 219.14 (July 16, 2026). Its average daily move was 67 pips and the median 48 pips, which is the number to keep in mind when you set a stop.
How much risk you stack with GBPJPY
Two trades that each risk 1% do not add up to a clean 2%, and they do not cancel to 0% either. A common estimate for the combined swing is the square root of (1 + 1 + 2 × correlation), in percent. With the three month readings, a long GBPJPY next to a second long trade looks like this:
| Second trade | 3M correlation | Combined risk | What it means |
|---|---|---|---|
| EURJPY | 0.93 | 1.96% | Almost one trade on two charts |
| USDJPY | 0.77 | 1.88% | Mostly the same yen bet |
| GBPUSD | 0.30 | 1.61% | Partly separate |
| EURGBP (long) | -0.23 | 1.24% | Partial hedge on the pound leg |
So the pair that most traders add for "diversification", EURJPY, adds almost nothing: 1.96% is close to a single 2% bet. If you want a second trade that behaves differently, a dollar pair such as EURUSD or USDCAD, with correlations near zero, is a better choice than another yen cross. For a deeper side by side, read our EURJPY vs GBPJPY comparison and the EURJPY correlation guide.
Sizing GBPJPY next to correlated pairs
GBPJPY is quoted in yen, so 1.0 lot (100,000 pounds) pays 1,000 yen per pip (0.01). At the November 11, 2026 ECB USDJPY rate of 159.23 that is about $6.28 per pip. For a $10,000 account risking 1% ($100), the size depends only on the stop:
| Stop | Lot size | Dollar risk |
|---|---|---|
| 40 pips | 0.39 lot | $97.97 |
| 50 pips | 0.31 lot | $97.34 |
| 60 pips | 0.26 lot | $97.97 |
| 80 pips | 0.19 lot | $95.46 |
| 100 pips | 0.15 lot | $94.20 |
Now add EURJPY with the same 50 pip stop. Full size on both (0.31 lot each) risks $194.68 on what is mostly one yen trade. One 1% budget split in two (0.15 lot each) risks $94.20 in total. Keeping only the cleaner chart at 0.31 lot risks $97.34. Lots are rounded down to the 0.01 step so the dollar risk never goes above plan.
Run your own numbers in the GBPJPY lot size calculator. Our USDJPY and GBPJPY lot size guide explains why the yen pip value moves with USDJPY, and the GBPUSD lot size guide covers the $10 per pip dollar side.
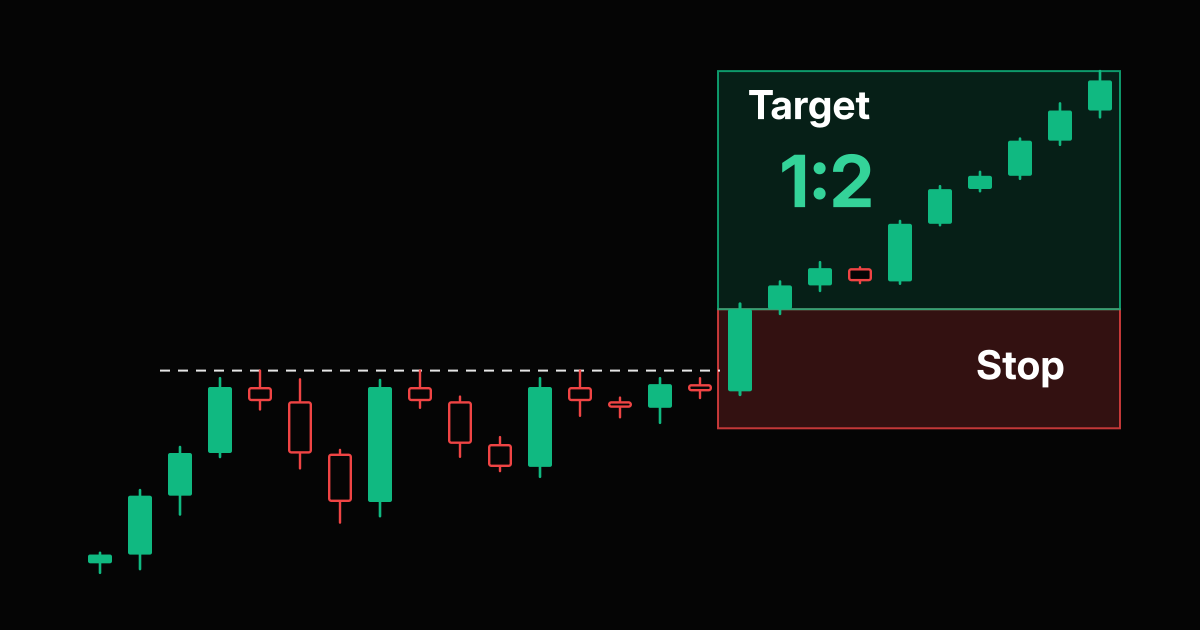
A five step GBPJPY correlation check
- Open the forex correlation matrix and read GBPJPY on the 1M and 3M tabs, not only 1Y.
- List every open yen trade. With EURJPY above 0.85, give GBPJPY and EURJPY one shared risk budget.
- Ask whether today is a pound day or a yen day. Check the calendar for Bank of England and Bank of Japan events and compare the GBPUSD and USDJPY moves.
- Want pound exposure without the yen? Trade GBPUSD. Want yen exposure? One yen pair is usually enough.
- Size from the stop, at about $6.28 per pip per 1.0 lot at USDJPY 159.23.
Pair pages worth bookmarking: EURJPY vs GBPJPY, EURGBP vs GBPJPY, GBPJPY vs USDCHF and AUDUSD vs GBPJPY. For the yen from the dollar side, read our USDJPY correlation article, and check any payoff with the risk reward calculator.
Frequently Asked Questions
What is GBPJPY most correlated with?
With EURJPY and the other yen crosses. On ECB reference rates over one year to November 11, 2026, GBPJPY daily returns had a 0.90 correlation with EURJPY, 0.81 with AUDJPY, 0.77 with CADJPY, 0.76 with CHFJPY and NZDJPY, and 0.66 with USDJPY.
Is GBPJPY correlated with GBPUSD?
Only weakly. The correlation was 0.33 over one year, 0.30 over three months and 0.29 over two years to November 11, 2026. GBPJPY and GBPUSD closed in the same direction on 161 of 256 days (63%). The link rises when the pound drives, as in the month to November 11, when it read 0.69.
Is GBPJPY correlated with USDJPY?
Yes, moderately to strongly: 0.66 over one year, 0.77 over three months and 0.67 over two years. On rolling three month windows it ranged from 0.39 (end of June 2026) to 0.87 (late October 2026), depending on whether the yen or the pound was moving.
Which pair hedges GBPJPY?
EURGBP had a negative correlation with GBPJPY: -0.36 over one year and -0.23 over three months to November 11, 2026. A long EURGBP is short the pound, so it partly offsets a long GBPJPY on pound days, but it does nothing against a yen move. Two 1% trades at -0.23 swing like about 1.24% of risk.
Can I trade GBPJPY and EURJPY at the same time?
Yes, but a long in both is close to one bigger short yen trade. At the three month correlation of 0.93, two trades risking 1% each swing like about 1.96% of risk. Give them one risk budget and split it, or keep only the cleaner chart.
What is the pip value of GBPJPY?
GBPJPY is quoted in yen, so 1.0 lot (100,000 pounds) pays 1,000 yen per pip (0.01). At the November 11, 2026 ECB USDJPY rate of 159.23 that is about $6.28 per pip, the same as on EURJPY and USDJPY.
Risk Disclaimer: Trading stocks, options, futures, forex, commodities, and cryptocurrencies involves substantial risk of loss and is not suitable for every investor. Past performance does not guarantee future results. This article is for educational purposes only and does not constitute financial advice. You should carefully consider your financial situation and risk tolerance before trading. Never trade with money you cannot afford to lose. Correlation readings change over time and are calculated from daily ECB reference rates to November 11, 2026, which can differ from your broker's prices. Contract sizes and minimum volumes vary by broker.